Bullish view
- Buy the EUR/USD pair and set a take-profit at 1.1750.
- Add a stop-loss at 1.1550.
- Timeline: 1-2 days.
Bearish view
- Sell the EUR/USD pair and set a take-profit at 1.1550.
- Add a stop-loss at 1.1750.

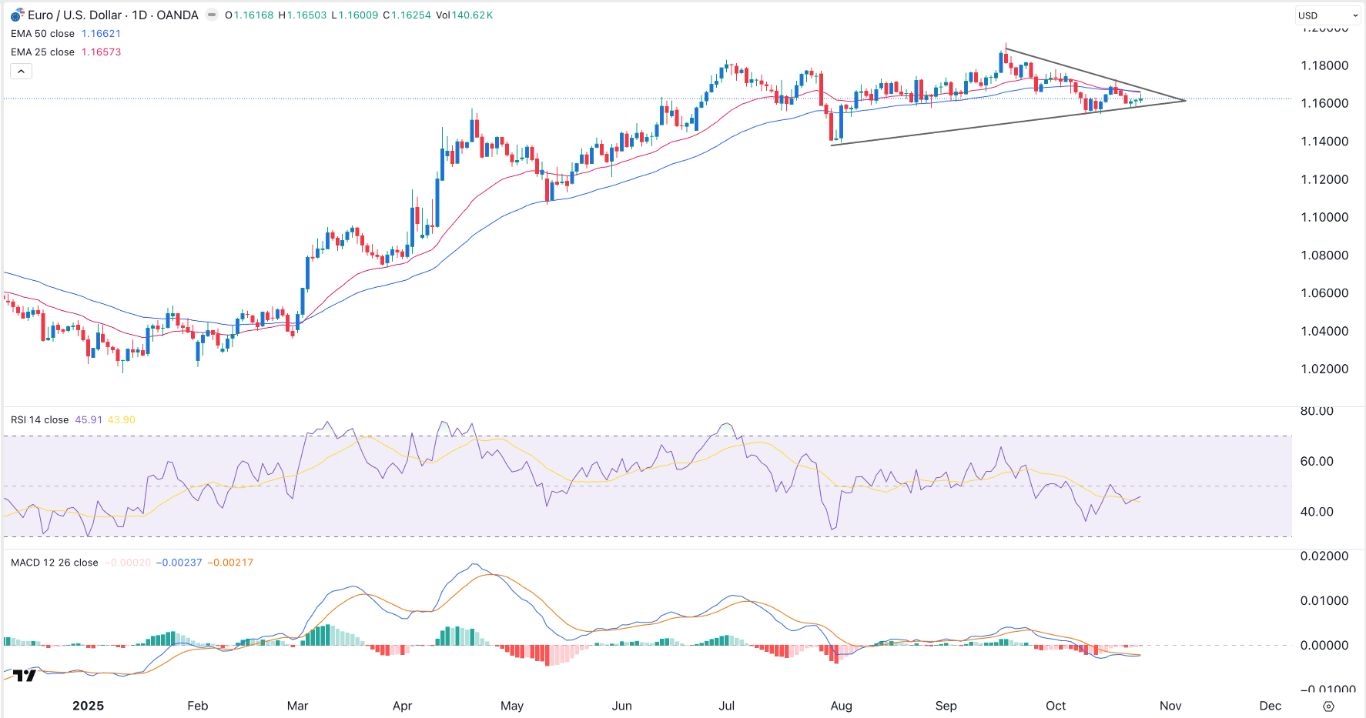
The EUR/USD exchange rate moved sideways after the US published encouraging consumer inflation data. It was trading at 1.1625 as investors now focused on the upcoming Federal Reserve and European Central Bank (ECB) decisions. This price is a few points below the year-to-date high of 1.1910.
ECB and Fed Decisions
The EUR/USD exchange rate has moved sideways in the past few months as traders waited for more cues from the Federal Reserve and the European Central Bank (ECB).
A report released on Friday confirmed that the Federal Reserve will cut rates this week. The report, released by the Bureau of Labor Statistics (BLS) showed that the headline Consumer Price Index (CPI) rose from 2.9% in August to 3.0% in September.
Core inflation, which excludes the volatile food and energy prices, dropped from 3.1% to 3.0%. While these numbers remained above the Fed’s 2.0% target they were not as high as what analysts were expecting.
Therefore, the bank will likely slash rates by 0.25% to support the ailing labor market. Recent data showed that the labor market remained under pressure as the private sector lost over 36,000 jobs.
Top Regulated Brokers
The next important EUR/USD news will be the upcoming European Central Bank (ECB) decision. Unlike the Fed, the ECB will likely leave rates unchanged as it has already achieved its inflation goals.
The pair will also react to the upcoming US Consumer Confidence report by the Conference Board. It will also be impacted by the upcoming talks between Donald Trump and Xi Jinping. These talks aim to de-escalate the rising tensions between the two countries.
EUR/USD Technical Analysis
The daily timeframe chart shows that the EUR/USD exchange rate has remained in a tight range in the past few months. It is hovering slightly below the 50-day and 25-day Exponential Moving Averages.
The MACD indicator is slightly below the zero line, while the Relative Strength Index is at 45. At the same time, the pair has formed a symmetrical triangle pattern whose two lines are about to converge.
Therefore, this arrangement is a sign that the pair is about to make a big move this week. A bullish breakout may push it closer to the year-to-date high of 1.1900. On the flipside, a move below the lower side of the triangle will invalidate the bullish forecast.
Ready to trade our free trading signals? We’ve made a list of the best European brokers to trade with worth using.
