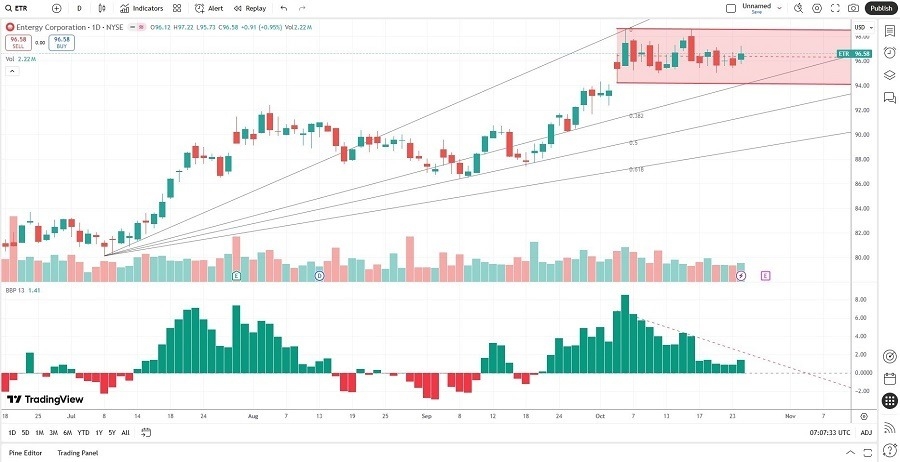
Short Trade Idea
Enter your short position between $94.26 (the lower band of its horizontal resistance zone) and $98.58 (the upper band of its horizontal resistance zone).
Market Index Analysis
- Entergy Corporation (ETR) is a member of the S&P 500 Index.
- This index is pushing higher on lower trading volumes, as the AI bubble expands.
- The Bull Bear Power Indicator of the S&P 500 shows a negative divergence and does not confirm the uptrend.
Market Sentiment Analysis
Equity futures suggest a bullish open after another record run last week, fueled by weaker than expected yet still high inflation data that confirmed hopes for another 25-basis point interest rate cut this week. After disappointing earnings from Netflix, Tesla, and IBM, markets hope that earnings from Alphabet, Microsoft, Meta, Amazon, and Apple will keep the rally intact, even as fears of an AI bubble rise. Expectations for a better-than-expected outcome of the Trump-Xi meeting in South Korea add to bullish sentiment this morning.
Entergy Corporation Fundamental Analysis
Entergy Corporation is a utility company that provides electric power with 24,000 megawatts of generating capacity. It serves over 3,000,000 customers in Arkansas, Louisiana, Mississippi, and Texas.
So, why am I bearish on ETR ahead of its earnings?
While data enter demand and warmer-than-expected temperatures may have increased revenues for Entergy Corporation in its latest quarter, I expect the multi-year profit margin contraction to continue amid higher input costs. Capital expenditures and the debt-to-equity ratio are high, the return on assets is meager, and the most recent dividend reduction raises a red flag.

Entergy Corporation Fundamental Analysis Snapshot
The price-to-earning (P/E) ratio of 23.97 makes ETR an expensive stock relative to its peers but inexpensive compared to the S&P 500 Index. By comparison, the P/E ratio for the S&P 500 is 30.52.
The average analyst price target for ETR is $99.69, suggesting negligible upside potential with magnified downside risks.
Entergy Corporation Technical Analysis
Today’s ETR Signal

Entergy Corporation Price Chart
- The ETR D1 chart shows price action inside a horizontal resistance zone.
- It also shows price action trading between its ascending 0.0% and 38.2% Fibonacci Retracement Fan levels.
- The Bull Bear Power Indicator is bullish with a descending trendline.
- The average bearish trading volumes are higher than the average bullish trading volumes.
- ETR advanced with the S&P 500, a bullish confirmation, but bearish signals have increased.
My Call on Entergy Corporation
Top Regulated Brokers
I am taking a short position in ETR between $94.26 and $98.58. Shareholder value destruction, shareholder value dilution, a declining dividend, and shrinking profit margins create a bearish scenario. I expect earnings to deliver a final breakdown catalyst with a contraction in earnings leading the way.
- ETR Entry Level: Between $94.26 and $98.58
- ETR Take Profit: Between $80.11 and $85.26
- ETR Stop Loss: Between $99.69 and $102.68
- Risk/Reward Ratio: 2.61
Ready to trade our daily stock signals? Here is our list of the best stock brokers worth reviewing.
