
A promising store remodeling program, healthy profit margins, and current valuations could hide a bargain for investors. Is it time to go shopping?
Long Trade Idea
Enter your long position between 96.14 (the lower band of its horizontal support zone) and 98.70 (the upper band of its horizontal support zone).
Market Index Analysis
- Dollar General (DG) is a member of the S&P 500.
- This index continues to ride the AI bubble higher, but bearish cracks continue to widen.
- The Bull Bear Power Indicator of the S&P 500 shows a negative divergence, and does not support the uptrend.
Market Sentiment Analysis
Deal-making within the AI sector continues after OpenAI announced a plan to invest in AMD, sending its shares skyrocketing and dragging equity markets higher. This circular deal-making suggests a bubble has formed. The US government remains shut down, and investors are gearing up for the third-quarter earnings season, where hopes are high for a continued outperformance outside of AI. Investors also hope for further interest rate cuts and treat all news as good, which is another bearish red flag.
Dollar General Fundamental Analysis
Dollar General is a discount retailer with over 19,000 stores and more than 170,000 employees. DG has its line of inexpensive private-label brands. It is also under heavy criticism for creating food deserts and low-wage jobs.
So, why am I bullish on DG, despite its 20%+ correction?
I am buying the Dollar General store remodeling initiative, which already prompted the company to increase its net sales growth guidance. The vote of confidence from the management team, healthy profit margins, and low valuations have created a long-term bargain for patient investors. I am equally confident in the “Jolly Good Deals” DG plans to roll out.
Dollar General Fundamental Analysis Snapshot
Metric | Value | Verdict |
P/E Ratio | 18.17 | Bullish |
P/B Ratio | 2.79 | Bearish |
PEG Ratio | 1.34 | Bullish |
Current Ratio | 1.25 | Bearish |
ROIC-WACC Ratio | Positive | Bullish |
The price-to-earnings (P/E) ratio of 18.17 makes DG an inexpensive stock. By comparison, the P/E ratio for the S&P 500 is 30.26.
The average analyst price target for DG is 120.61. It suggests good upside potential with manageable downside risks.
Top Regulated Brokers
Dollar General Technical Analysis
Today’s DG Signal
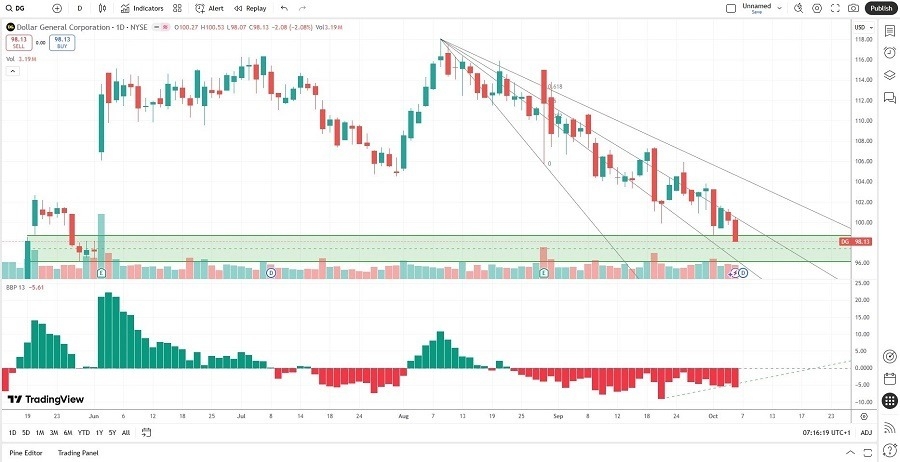
- The DG D1 chart shows price action entering a massive horizontal support zone.
- It also shows price action between the descending 38.2% and 50.0% Fibonacci Retracement Fan level.
- The Bull Bear Power Indicator is bearish, but a positive divergence has formed.
- Bearish trading volumes have decreased since DG approached its horizontal support zone.
- DG corrected as the S&P 500 pushed higher, a bearish development, but bullish catalysts have emerged.
My Call
I am taking a long position in DG between 96.14 and 98.70. I appreciate the growth potential of DG stemming from its store remodeling. Current valuations are inexpensive, and the PEG ratio suggests more upside ahead.
- DG Entry Level: Between 96.14 and 98.70
- DG Take Profit: Between 115.00 and 117.95
- DG Stop Loss: Between 87.86 and 90.62
- Risk/Reward Ratio: 2.28
Ready to trade our daily signals? Here is our list of the best brokers for trading worth checking out.