
- High valuations, a meager dividend, and selling pressure despite another upbeat earnings report suggest a lack of confidence. Is more downside ahead?
Short Trade Idea
Enter your short position between 198.36 (yesterday’s intra-day low) and 205.93 (the intra-day high of the last bullish candlestick that formed the upper band of its bearish price channel).
Market Index Analysis
- Cintas Corporation (CTAS) is a member of the NASDAQ 100 and the S&P 500.
- Both indices continue to ride the AI bubble higher, but bearish cracks continue to widen.
- The Bull Bear Power Indicator of the S&P 500 shows a negative divergence, and does not support the uptrend.
Market Sentiment Analysis
Deal-making within the AI sector continues after OpenAI announced a plan to invest in AMD, sending its shares skyrocketing and dragging equity markets higher. This circular deal-making suggests a bubble has formed. The US government remains shut down, and investors are gearing up for the third-quarter earnings season, where hopes are high for a continued outperformance outside of AI. Investors also hope for further interest rate cuts and treat all news as good, which is another bearish red flag.
Cintas Corporation Fundamental Analysis
Cintas Corporation provides corporate uniforms via rental and sales programs. It also sells a range of office equipment from janitorial to safety products. It is one of the largest companies in its sector with over 44,000 employees.
So, why am I bearish on CTAS amid its sell-off?
While Cintas Corporation delivers solid earnings reports, investors remain unconvinced. Economic uncertainty, tariff confusion, and foreign exchange impacts on earnings pose bearish catalysts. Despite the sell-off, valuations remain high. CTAS has announced technology investments that could improve operations in the long term. Still, the short-term outlook remains skewed to the downside.
Cintas Corporation Fundamental Analysis Snapshot
Metric | Value | Verdict |
P/E Ratio | 45.09 | Bearish |
P/B Ratio | 17.19 | Bearish |
PEG Ratio | 3.87 | Bearish |
Current Ratio | 2.09 | Bullish |
ROIC-WACC Ratio | Positive | Bullish |
The price-to-earnings (P/E) ratio of 45.09 makes CTAS an expensive stock. By comparison, the P/E ratio for the S&P 500 is 30.26.
The average analyst price target for CTAS is 217.44. It suggests moderate upside potential, but downside risks are notable.
Top Regulated Brokers
Cintas Corporation Technical Analysis
Today’s CTAS Signal
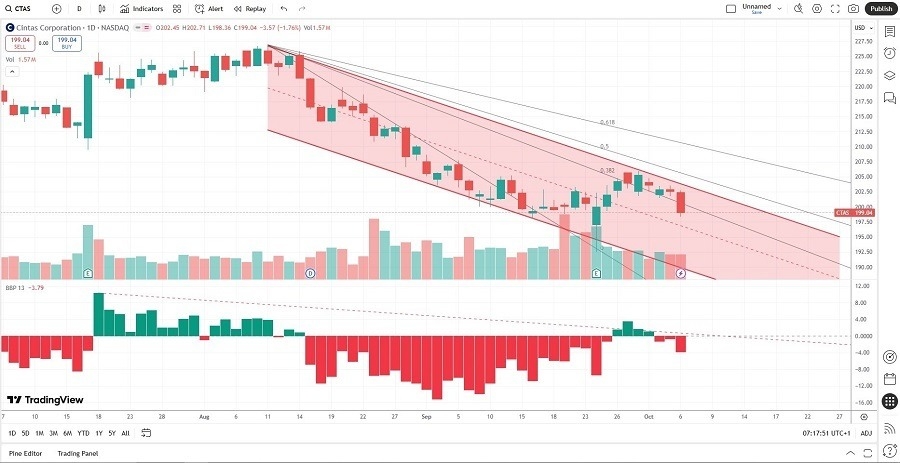
- The CTAS D1 chart shows price action inside a bearish price channel.
- It also shows price action between the descending 0.0% and 38.2% Fibonacci Retracement Fan level.
- The Bull Bear Power Indicator is bearish with a descending trendline.
- The average bearish trading volumes are higher than the average bearish trading volumes.
- CTAS corrected as the S&P 500 recorded fresh all-time highs, a significant bearish trading signal.
My Call
I am taking a short position in CTAS between 198.36 and 205.93. Despite a 10% sell-off, valuations remain high, the PEG ratio flashes a sell signal, and upbeat earnings continue to fail to lift its share price amid stagflationary conditions.
- CTAS Entry Level: Between 198.36 and 205.93
- CTAS Take Profit: Between 162.16 and 167.62
- CTAS Stop Loss: Between 214.01 and 219.87
- Risk/Reward Ratio: 2.31
Ready to trade our free signals? Here is our list of the best brokers for trading worth checking out.