Bearish view
- Sell the BTC/USD pair and set a take-profit at 100,000.
- Add a stop-loss at 112,000.
- Timeline: 1-2 days.
Bullish view
- Buy the BTC/USD pair and set a take-profit at 112,000.
- Add a stop-loss at 104,000.

Bitcoin price remained under pressure as a sense of fear in the market continued. The BTC/USD pair dropped to a low of 108,150, down from the year-to-date high of 126,230.
Bitcoin Price Crashes as Demand Wanes
The BTC/USD pair slipped as investors remained fearful ahead of the upcoming US inflation data. Data compiled by CoinMarketCap shows that the closely-watched Fear and Greed Index slipped to the fear zone of 26. Cryptocurrencies normally drop when there is a sense of fear.
Bitcoin also declined as the US dollar continued rising. The closely-watched US Dollar Index (DXY) jumped to $100, up from the year-to-date low of $96. Bitcoin tends to have an inverse relationship with the US dollar because it is normally priced in the currency.
The BTC/USD pair also pulled back as traders waited for the upcoming talks between the US and China, which are aimed at resolving the ongoing conflicts. Tensions rose this week after media reports said that Donald Trump was considering ending sales of some critical software.
China also ramped up its investigation on some American companies like Analog Devices and Texas Instruments. It is also investigating Qualcomm, a company that makes software used in smartphones and PCs. These tensions also explain why the stock market also crashed on Wednesday.
Top Regulated Brokers
Meanwhile, the recent hype on Bitcoin treasury companies has faded as the NAV multiple for most companies, including Metaplanet and Strategy has fallen in the past few days. Bitcoin holdings by these companies has largely stagnated on the past few months after recording substantial growth earlier this year as companies aimed to emulate Strategy.
BTC/USD Technical Analysis
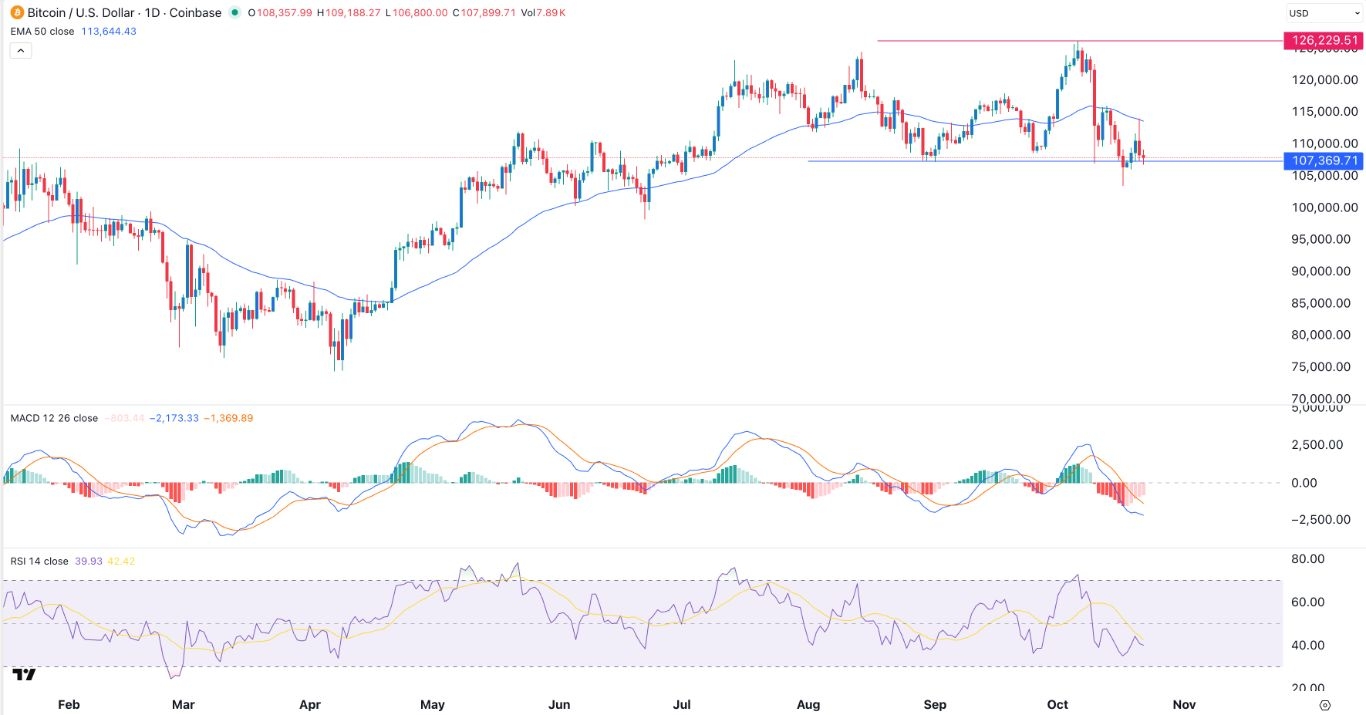
The daily timeframe chart shows that the BTC/USD pair has slumped after hitting its all-time high earlier this month. It has moved from the year-to-date high of 126,230 to the current 108,000.
The coin has formed a double-top pattern and is now at the neckline. Its attempts to rebound found substantial resistance at the 50-day Exponential Moving Average (EMA).
Meanwhile, the Relative Strength Index has moved below the neutral point at 50, while the MACD has dropped below the zero line.
Bitcoin has also formed a bearish flag pattern, which is made up of a vertical line and some of consolidation. Therefore, the pair will likely continue falling as sellers target the next key support level at 100,000 in the near term.
Ready to trade our daily Forex signals? Here’s a list of some of the best crypto brokers to check out.
