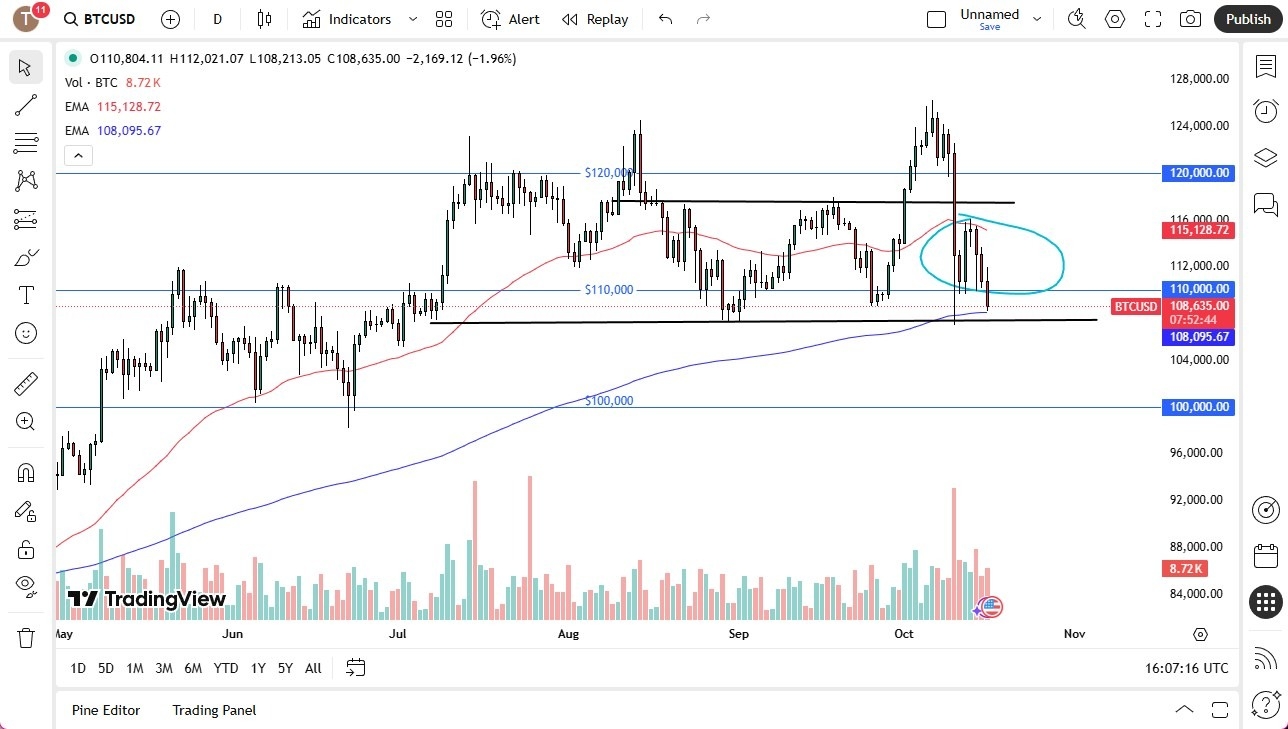
- The Bitcoin market rallied slightly during the trading session on Thursday, to test the $112,000 level.
- The $112,000 level is a significant area that could offer a little bit of resistance due to the fact that we have already given back the momentum from that level, and the fact that it is a round figure.
- That being said, this is a market that will be paying close attention to the 200 Day EMA just below, because if we give that up, it could be a very ugly turn of events for Bitcoin in general.
Technical Analysis
Top Regulated Brokers
The technical analysis for this pair is rather ugly in the short term, but over the longer term we are still very much in a sideways market, and as long as we can stay above the $108,000 level, then it gives us a shot at going sideways overall. The $116,000 level features recent resistance, and the $115,000 level features the 50 Day EMA. Blowing through both of those would be extraordinarily bullish but considering that the bulk of volume has been negative, I don’t have high hopes for Bitcoin at the moment. This isn’t to say that I’m looking for it to collapse, just that I don’t see a massive bullish run coming anytime soon.
I would expect volatility in this market, and I would also expect the NASDAQ 100 to have a major amount of influence on this pair as well. After all, it is a market that tends to be very highly correlated with technology stocks, which of course are the main driver of not only the NASDAQ 100, but the S&P 500 for that matter. Risk appetite will continue to be a major issue, and as long as that’s the case you’re going to have to keep an eye on most markets. If we can rally from here and recapture the $110,000 level, it may be a sign of stability if nothing else.
Ready to trade Bitcoin forex forecast? Here’s a list of some of the best crypto brokers to check out.

