
- Bitcoin (BTC) has shattered its previous all-time high, surging to a record $125,725 on Sunday amid renewed institutional inflows and seasonal tailwinds.
As “Uptober” gets underway, analysts eye ambitious targets for Bitcoin up to $145,000, fueled by historical patterns and onchain signals.
October Has Always Been Good for Bitcoin
October has consistently delivered good returns for Bitcoin, earning the nickname “Uptober” through robust historical performance.
CoinGlass data shows an average October return of 28.5% between 2013 and 2024, outpacing most months. If history repeats itself, it means that from the monthly opening of $114,080, Bitcoin price could rise by an average of 28.5% to $141,544 by October 31.
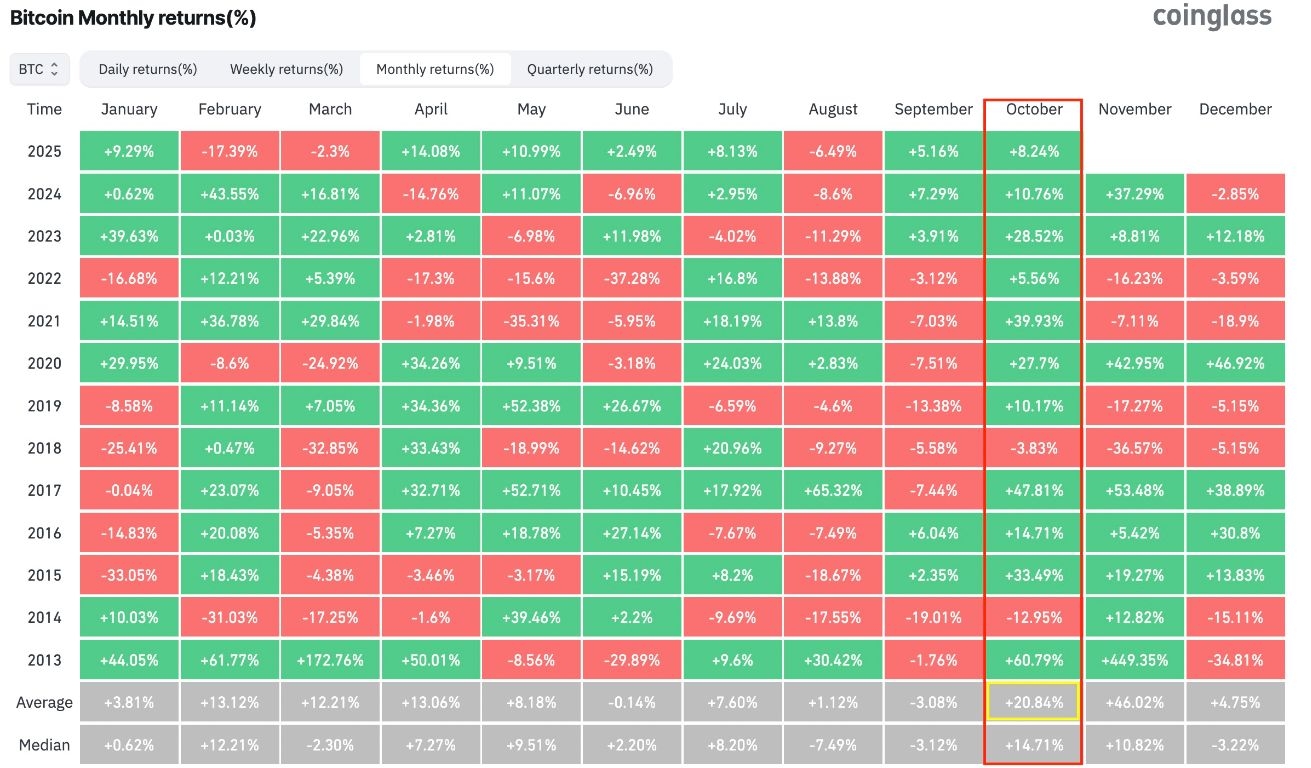
Bitcoin monthly returns, %. Source: CoinGlass
This strength spans market cycles: in 2013, Bitcoin soared 61% amid early hype; 2017 saw a 47% jump during the ICO craze; and 2021 delivered 40% as DeFi and halving buzz took hold. Even 2023’s 28.52% and 2024’s 11% gains, tied to ETF approvals, reinforce the trend.
“Uptober’s” edge is attributed to factors like low Q3 liquidity flipping to Q4 buying pressure, year-end portfolio rebalancing, and reduced exchange supply—currently at 2.8 million BTC, levels last seen in June 2019.
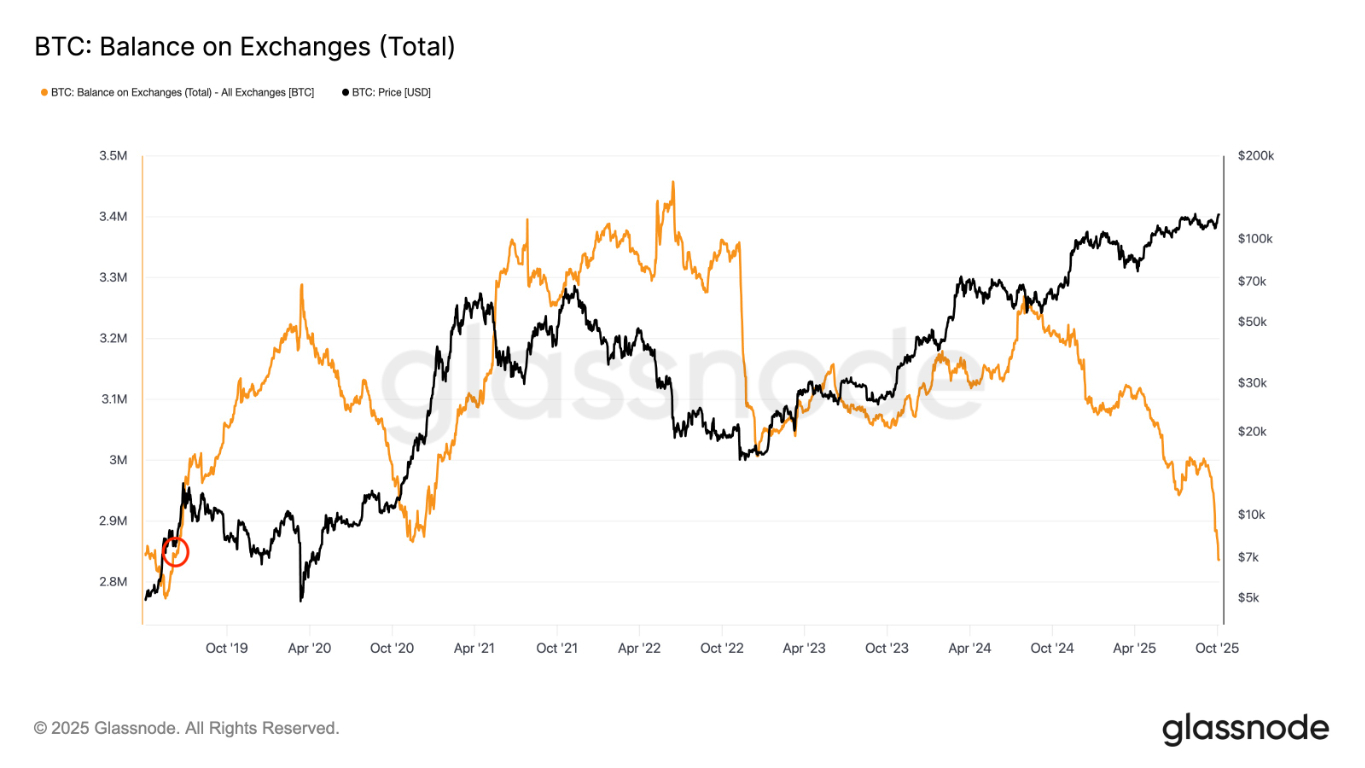
Bitcoin Balance on Exchanges – Source Glassnode
Volatility metrics show October’s average true range at 12%-15%, ideal for breakouts without excessive dumps. With $2.5 billion in ETF inflows last week and Bitcoin up 32% year-to-date, a 20%-30% climb from the current level at $125,000, potentially reaching $150,000 by the end of October— which also aligns with historical averages.
Traders are watching Bitcoin’s real-time flows to gauge if “Uptober 2025” will match or exceed its legacy as one of the asset’s most bullish months.
Onchain Data Suggest BTC’s Next Key Resistance is $140,000 H2
Glassnode’s MVRV Extreme Deviation Pricing Bands offer a data-driven view on Bitcoin’s next hurdle, pegging resistance at $140,000—the uppermost band signaling peak euphoria.
The MVRV ratio, comparing market cap to realized cap, currently sits at a Z-Score of 2.1, indicating bullish but not overbought conditions. The $139,300 level, at 1 standard deviation from the realized price, historically marks cycle tops, like 2017’s $20,000 or 2021’s $69,000.
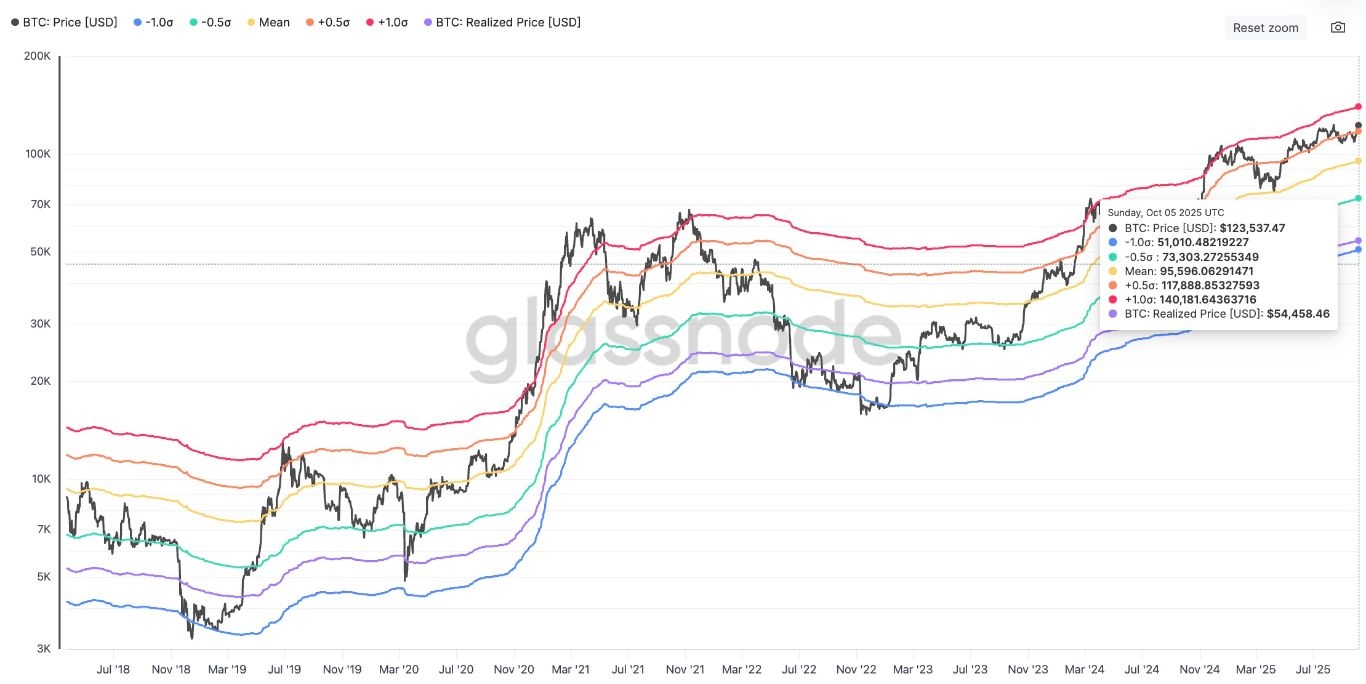
Bitcoin MVRV extreme deviation pricing bands. Source: Glassnode
On the higher side, past breaches of this level, like October 2020’s $13,000 test, preceded 100% rallies. Therefore, if Bitcoin branches the upper band at $140,000, it could double in price toward $280,000, if history was to repeat itself.
Noteworthy, there would be approximately $500 billion in potential realized profits at $140,000, suggesting the emergence of profit-taking risks at this level, especially from short-term holders who make up 40% of volume.
On the other hand, long-term holders (75% of supply) remain steadfast, and the Pi Cycle Top Indicator is 65% from signaling a top. If Bitcoin holds above $125,000, on-chain flows suggest a climb to $140,000 by mid-October, setting the stage for further gains.
Bitcoin’s bull flag breakout targets $145,000 H2
BTC price technicals show it gained momentum after breaking out of a bull flag pattern on the daily chart, as shown below.
A bull flag pattern is a bullish setup that forms after the price consolidates inside a down-sloping range following a sharp price rise.
Bull flags typically resolve after the price breaks above the upper trendline and rises by as much as the previous uptrend’s height.
Bitcoin broke above the upper boundary of the flag at $116,000 on Wednesday, last week, opening the way for a rally toward the pattern’s target at $145,400, or a 17% increase from the current price.
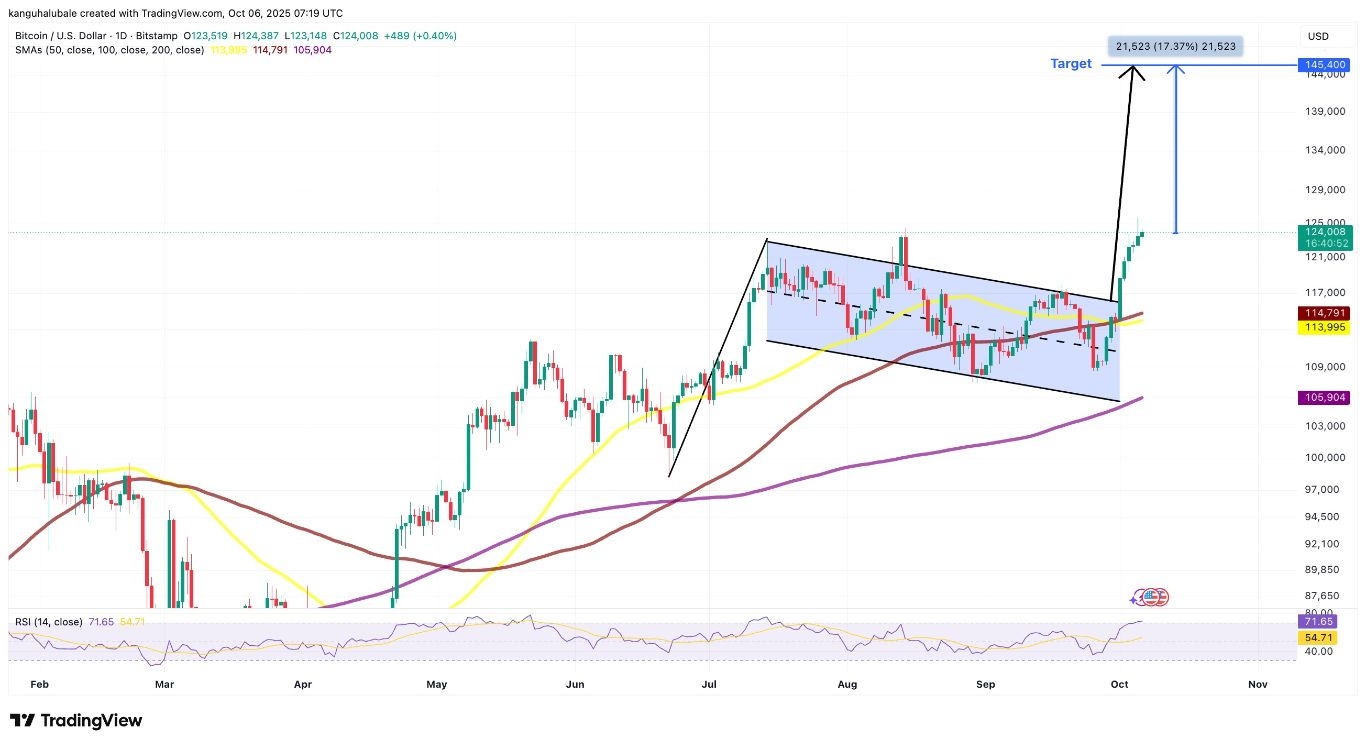
BTC/USD daily chart. Source: TradingView
It is important to note that bull flags gave a 75% success rate: 2021’s $40,000 breakout hit $65,000 while 2024’s $50,000 flag reached $73,000.
The relative strength index is overbought at 71, suggesting that buyer exhaustion could result in a correction followed by profit-taking over the next few days.
If this happens, Bitcoin could drop first to retest the August 14th high at $124,500 and later to the psychological level at $120,000, before resuming the uptrend.
While profit-taking risks loom, low Bitcoin supply on exchanges and persistent institutional demand through ETFs and corporate treasuries suggest Bitcoin could go as high as $145,000 by month’s end, cementing Uptober’s bullish legacy.
Top Regulated Brokers
Ready to trade our technical analysis of Bitcoin? Here’s our list of the best MT4 crypto brokers worth checking out.