
Negative net income, negative cash flow from operations, trust and safety issues, and a damaged reputation continue to haunt Boeing. Will the breakdown sequence continue?
Short Trade Idea
Enter your short position between 210.73 (the intra-day low of its last bearish candlestick) and 218.80 (the intra-day high of its last bullish candlestick).
Market Index Analysis
- Boeing (BA) is a member of the Dow Jones Industrial Average, the S&P 100, and the S&P 500.
- All three indices hover near record highs, but correction catalysts and bubble fears are spreading.
- The Bull Bear Power Indicator of the S&P 500 has turned bearish with a descending trendline.
Market Sentiment Analysis
After Equity markets rebounded yesterday from Friday’s massive sell-off, it may be a dead-cat bounce, with futures lower this morning. The third-quarter earnings season begins today, with JPMorgan Chase, Citigroup, Goldman Sachs, and Wells Fargo reporting results. The government shutdown continues to delay key economic reports. Therefore, markets could put additional weight on Fed Chair Powell’s speech at the National Association for Business Economics (NABE) annual meeting. The ongoing tariff threat and the Trump administration’s pivots should keep markets on edge, while silver rallies to all-time highs.
Boeing Fundamental Analysis
Boeing is an aerospace and defense company that designs, manufactures, and sells airplanes, rotorcraft, rockets, satellites, and missiles. It is also the most significant US exporter by dollar value.
So, why am I bearish on BA following its latest breakdown?
The Boeing Company reported negative earnings for the past five years. The past two years saw flat unit sales, suggesting ongoing struggles to recover from reputational damage stemming from safety concerns and mass fleet groundings. BA has a high cash burn, which could delay future defense projects and derail its long-term business plan. Therefore, BA might have to raise funds, dilute existing shareholders, and embark on a downward spiral.
Boeing Fundamental Analysis Snapshot
Metric | Value | Verdict |
P/E Ratio | Unavailable | Bearish |
P/B Ratio | Unavailable | Bearish |
PEG Ratio | 6.53 | Bearish |
Current Ratio | 1.23 | Bearish |
ROIC-WACC Ratio | Unavailable | Bearish |
The price-to-earnings (P/E) ratio for BA is unavailable.
The average analyst price target for BA is 252.95. It suggests good upside potential, but downside risks are high.
Boeing Technical Analysis
Today’s BA Signal
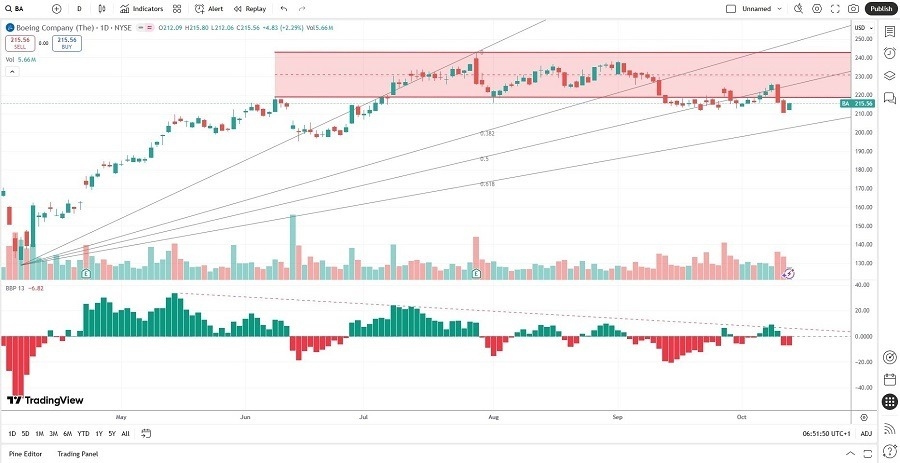
- The BA D1 chart shows price action breaking down below its horizontal resistance zone.
- It also shows price action between its ascending 50.0% and 61.8% Fibonacci Retracement Fan levels.
- The Bull Bear Power Indicator is bearish with a descending trendline.
- The average bearish trading volumes are higher than the average bullish trading volumes.
- BA corrected as the S&P 500 remains near record highs, a significant bearish trading signal.
My Call
I am taking a short position in BA between 210.73 and 218.80. BA faces weakening fundamentals in its bookings and sales outlook. High infrastructure costs with upside price pressure, and high debt levels add to bearish catalysts.
- BA Entry Level: Between 210.73 and 218.80
- BA Take Profit: Between 128.88 and 149.41
- BA Stop Loss: Between 242.69 and 252.95
- Risk/Reward Ratio: 2.56
Top Regulated Brokers
Ready to trade our daily stock signals? Here is our list of the best stock brokers worth reviewing.