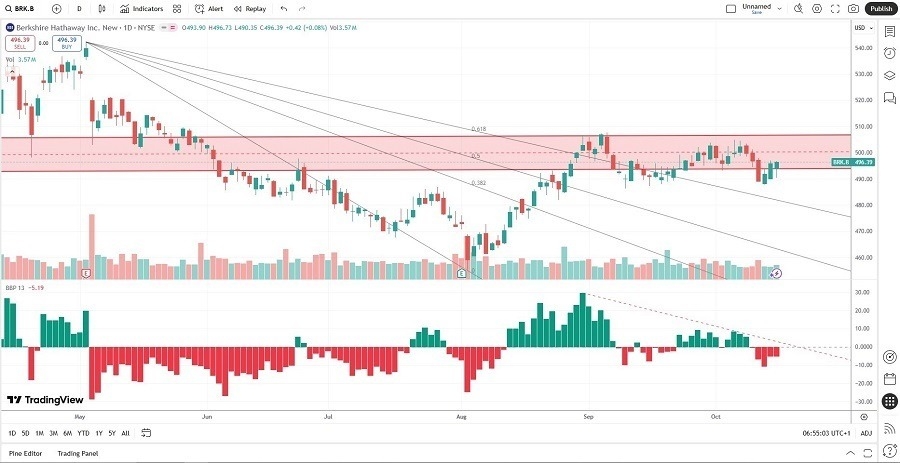
Short Trade Idea
Enter your short position between $492.98 (the lower band of its horizontal resistance zone) and $505.85 (the upper band of its horizontal resistance zone).
Market Index Analysis
- Berkshire Hathaway (BRK.B) is a member of the S&P 100 and the S&P 500 indices.
- Both indices remain near all-time highs against a backdrop of bearish signals.
- The Bull Bear Power Indicator of the S&P 500 shows a negative divergence and does not support the uptrend.
Market Sentiment Analysis
Equity markets ignored the reescalation of the US-China trade war and focused on bank earnings, which, unsurprisingly, beat expectations amid the AI bubble. The Fed’s Beige Book dampened optimism and drove indices from their session highs. The government shutdown continues with no end in sight. Attempts by Treasury Secretary Scott Bessent to calm markets by stating President Trump still intends to meet President Xi later this month have had little effect, while President Trump confirmed the trade war. Stagflationary conditions persist, the AI bubble continues to expand, and volatility remains.
Berkshire Hathaway Fundamental Analysis
Berkshire Hathaway is a multinational conglomerate holding company that many compare to an investment fund. In the ten years ending in 2023, Berkshire Hathaway produced a compound annual growth rate of 11.8% versus 12.0% for the S&P 500.
So, why am I bearish on BRK.B inside its resistance zone?
Berkshire Hathaway has excellent name recognition, but beneath the company are massive cracks. The return on invested capital (ROIC) is below the cost of capital (WACC), a sign of shareholder value destruction. Profit margins have been shrinking, BRK.B does not pay a dividend, and it faces a challenging medium-term outlook, with many of its core businesses dependent on a healthy economy and tame inflation.

Berkshire Hathaway Fundamental Analysis Snapshot
The price-to-earnings (P/E) ratio of 17.01 makes BRK.B an inexpensive stock. By comparison, the P/E ratio for the S&P 500 is 30.08.
The average analyst price target for BRK.B is $519.67. It suggests moderate upside potential with rising downside pressures.
Berkshire Hathaway Technical Analysis
Today’s BRK.B Signal

Berkshire Hathaway Price Chart
- The BRK.B D1 chart shows price action inside its horizontal resistance zone.
- It also shows price action above its descending Fibonacci Retracement Fan.
- The Bull Bear Power Indicator is bearish with a descending trendline.
- The average bearish trading volumes are higher than the average bullish trading volumes.
- BRK.B moved lower as the S&P 500 index pushed higher, a significant bearish trading signal.
My Call on Berkshire Hathaway
I am taking a short position in BRK.B between $492.98 and $505.85. BRK.B has struggled for over 12 years. Profit margins have contracted for years, and the compound annual growth rate is substandard, while investors receive no dividends.
- BRK.B Entry Level: Between $492.98 and $505.85
- BRK.B Take Profit: Between $406.11 and $417.28
- BRK.B Stop Loss: Between $524.00 and $542.07
- Risk/Reward Ratio: 2.80
Ready to trade our daily stock signals? Here is our list of the best stock brokers worth reviewing.
