
A healthy dividend yield, low valuations, and defensive portfolio qualities make this stock an appealing call. Should you dial up AT&T?
Long Trade Idea
Enter your long position between $24.98 (the lower band of its horizontal support zone) and $26.30 (yesterday’s intra-day high).
Market Index Analysis
- AT&T (T) is a member of the S&P 100 and the S&P 500 indices.
- Both indices remain near all-time highs, while correction catalysts continue to accumulate.
- The Bull Bear Power Indicator of the S&P 500 shows a negative divergence and does not support the uptrend.
Market Sentiment Analysis
Equity markets pulled back yesterday, as Oracle, another AI stock, dragged markets down. The AI dominance continues to disrupt markets positively and negatively, but investors have also turned their attention to the upcoming third-quarter earnings season. Another area of concern is the Fed, which has limited data to rely on for its next interest rate decision as the government shutdown continues. Markets hope for another 25-basis-point interest rate cut, a healthy earnings season, and validation from AI stocks, but could find disappointment on more than one front.
AT&T Fundamental Analysis
AT&T is a telecommunications holding company. It is also the third-largest telecom company by revenue globally and the third-largest mobile company in the US.
So, why am I bullish on T, despite its current pullback?
I appreciate the defensive capabilities of AT&T, and the excellent dividend yield compensates investors well for short-term volatility. Yesterday’s surprise CEO change at Verizon signals increased competition ahead, and I rank AT&T as the company that has the most to gain, given its solid foundation and driven by quality profit margins. The road ahead may be rough, but I like AT&T and its dividend at current levels, given its PEG ratio.
Metric | Value | Verdict |
P/E Ratio | 14.95 | Bullish |
P/B Ratio | 1.83 | Bullish |
PEG Ratio | 0.98 | Bullish |
Current Ratio | 0.81 | Bearish |
ROIC-WACC Ratio | Negative | Bearish |
AT&T Fundamental Analysis Snapshot
The price-to-earnings (P/E) ratio of 14.95 makes T an inexpensive stock. By comparison, the P/E ratio for the S&P 500 is 30.29.
The average analyst price target for T is $30.66. It suggests good upside potential, while downside risks remain acceptable.
AT&T Technical Analysis
Today’s T Signal
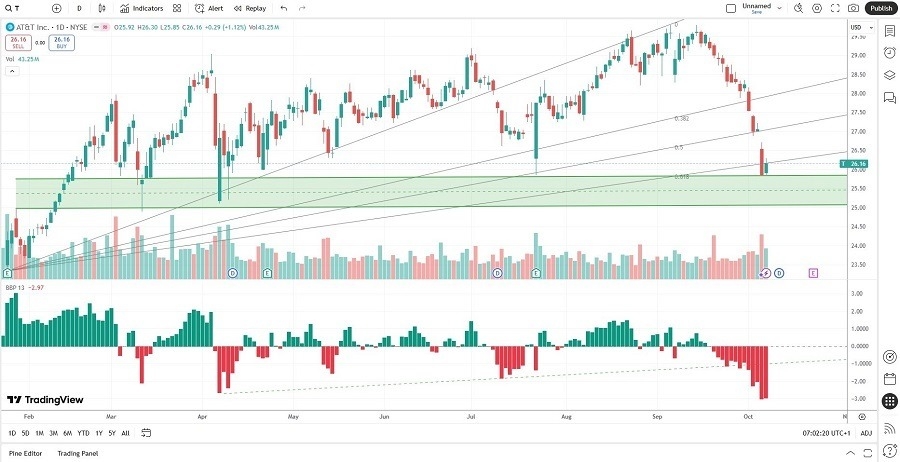
AT&T Price Chart
- The T D1 chart shows price action bouncing off a massive horizontal support zone.
- It also shows price action just below its ascending Fibonacci Retracement Fan.
- The Bull Bear Power Indicator is bearish and shows signs of downward exhaustion.
- Bullish trading volumes remain solid and outpace average bearish volumes.
- T corrected as the S&P 500 pushed higher, a bearish development, but bullish catalysts have emerged.
My Call on AT&T
I am taking a long position in T between $24.98 and $26.30. The pullback lowered valuations and dropped AT&T into a solid horizontal support zone. I am dialing up the defensive capabilities of this dividend powerhouse and trust its twelve-month business trajectory.
- T Entry Level: Between $24.98 and $26.30
- T Take Profit: Between $29.79 and $30.66
- T Stop Loss: Between $23.35 and $24.37
- Risk/Reward Ratio: 2.95
Top Regulated Brokers
Ready to trade our daily stock signals? Here is our list of the best stock brokers worth reviewing.