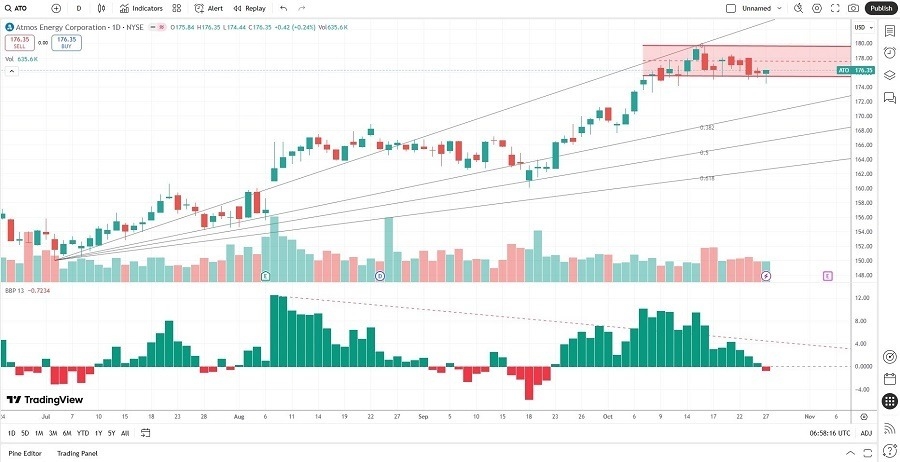
Short Trade Idea
Enter your short position between $175.49 (the lower band of its horizontal resistance zone) and 179.70 (the upper band of its horizontal resistance zone).
Market Index Analysis
- Atmos Energy (ATO) is a member of the S&P 500 Index.
- This index recorded a fresh record high, fueled by an AI bubble.
- The Bull Bear Power Indicator of the S&P 500 is bullish but indicates upward exhaustion.
Market Sentiment Analysis
Equity futures are trading in and out of positive territory. Yesterday’s session saw bulls take charge amid optimism about a broader US-China trade deal that could include agreements on rare-earth minerals, soybeans, and TikTok. The FOMC will start its two-day meeting today. While markets have priced in a 0.25% interest rate cut, attention will shift to the outlook, where divisions among voting members could widen over future rate cuts. In the meantime, the AI bubble continues to expand globally, and underlying risks are rising.
Atmos Energy Fundamental Analysis
Atmos Energy is one of the largest US natural-gas-only distributors, serving approximately 3,000,000 customers in nine states. It also manages a company-owned natural gas pipeline and storage assets.
So, why am I bearish on ATO ahead of earnings?
ATO missed the target on its last earnings report, but the negative revenue growth and negative free cash flow stand out. The Invested Capital (ROIC) is below the Cost of Capital (WACC), a red flag indicating value destruction. Atmos Energy ranks among the most overvalued companies in its industry, with a high PEG ratio and an unimpressive dividend yield, as its earnings growth trails its dividend growth.

Atmos Energy Fundamental Analysis Snapshot
The price-to-earning (P/E) ratio of 24.39 makes ATO an expensive stock compared to its peers but inexpensive relative to the S&P 500 Index. By comparison, the P/E ratio for the S&P 500 is 30.52.
The average analyst price target for ATO is $170.00, suggesting no upside potential with excessive downside risks.
Atmos Energy Technical Analysis
Today’s ATO Signal Atmos Energy Price Chart
- The ATO D1 chart shows price action inside a horizontal resistance zone.
- It also shows price action between its ascending 0.0% and 38.2% Fibonacci Retracement Fan levels.
- The Bull Bear Power Indicator is bullish with a negative divergence.
- The average bearish trading volumes are higher than the average bullish trading volumes.
- ATO began a sideways trend as the S&P 500 Index hit fresh records, a bearish confirmation.
Top Regulated Brokers
My Call on Atmos Energy
I am taking a short position in ATO between $175.49 and $179.70. High valuations, negative free cash flow, negative revenue growth, and value destruction are bearish catalysts that could lead to a breakdown.
- ATO Entry Level: Between $175.49 and $179.70
- ATO Take Profit: Between $154.23 and $160.10
- ATO Stop Loss: Between $183.29 and $188.79
- Risk/Reward Ratio: 2.73
Ready to trade our free stock signals? Here is our list of the best stock brokers worth checking out.
