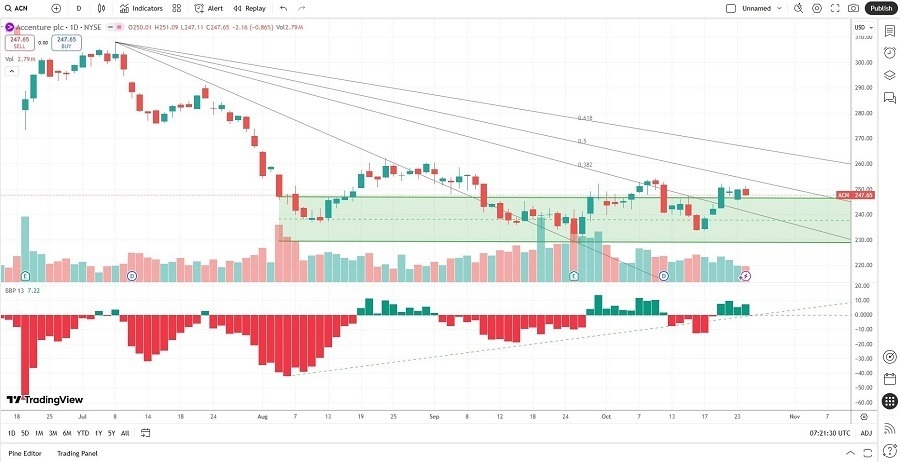
Long Trade Idea
Enter your long position between $233.75 (the intra-day low before its breakout move) and $254.17 (the intra-day high of a previous breakout).
Market Index Analysis
- Accenture (ACN) is a member of the S&P 100 and the S&P 500 indices.
- Both indices are pushing higher on lower trading volumes, as the AI bubble expands.
- The Bull Bear Power Indicator of the S&P 500 shows a negative divergence and does not confirm the uptrend.
Market Sentiment Analysis
Equity futures suggest a bullish open after another record run last week, fueled by weaker than expected yet still high inflation data that confirmed hopes for another 25-basis-point interest rate cut this week. After disappointing earnings from Netflix, Tesla, and IBM, markets hope that earnings from Alphabet, Microsoft, Meta, Amazon, and Apple will keep the rally intact, even as fears of an AI bubble rise. Expectations for a better-than-expected outcome of the Trump-Xi meeting in South Korea add to bullish sentiment this morning.
Accenture Fundamental Analysis
Accenture is a multinational professional services company with over 770,000 employees, specializing in information technology (IT) services and management consulting. It operates five business units: Strategy and Consulting, Technology, Operations, Accenture Song, and Industry X.
So, why am I bullish on ACN after its earnings release?
ACN reported nearly 10% annual revenue growth over the past five years, increasing its market share impressively. Its revenue base is almost $70 billion, and the Accenture management team has a proven track record of understanding its industry. The double-digit dividend growth is a nice bonus. I am also bullish on the deal between Accenture and NVIDIA, as it should give the company a competitive edge in the AI sector.

Accenture Fundamental Analysis Snapshot
The price-to-earnings (P/E) ratio of 20.37 makes ACN an inexpensive stock. By comparison, the P/E ratio for the S&P 500 is 30.52.
The average analyst price target for ACN is $277.60. This suggests moderate upside potential, but I expect upward revisions, boosted by fading downside risk.
Accenture Technical Analysis
Today’s ACN Signal

Accenture Price Chart
- The ACN D1 chart shows price action breaking out above its horizontal support zone.
- It also shows price action between its descending 38.2% and 50.0% Fibonacci Retracement Fan level.
- The Bull Bear Power Indicator is bullish with an ascending trendline.
- The average bearish trading volumes are higher than the average bullish trading volumes.
- ACN corrected as the S&P 500 Index advanced, a bearish confirmation, but bullish catalysts have emerged.
My Call on Accenture
Top Regulated Brokers
I am taking a long position in ACN between $233.75 and $254.17. The partnership between ACN and NVIDIA can accelerate the current breakout, as investors benefit from a decent valuation for an AI-related investment.
- ACN Entry Level: Between $233.75 and $254.17
- ACN Take Profit: Between $307.77 and $325.71
- ACN Stop Loss: Between $207.04 and $217.93
- Risk/Reward Ratio: 2.77
Ready to trade our daily stock signals? Here is our list of the best stock brokers worth reviewing.
