
Negative cash flow from operations, declining profit margins, and contracting earnings per share flash red flags. Is more downside ahead for MMM?
Short Trade Idea
Enter your short position between $155.18 (yesterday’s intra-day low) and $159.47 (the lower band of its horizontal resistance zone).
Market Index Analysis
- 3M Company (MMM) is a member of the Dow Jones Industrial Average, S&P 100, and the S&P 500 indices.
- All three indices remain near all-time highs, while correction catalysts continue to accumulate.
- The Bull Bear Power Indicator of the S&P 500 shows a negative divergence and does not support the uptrend.
Market Sentiment Analysis
Equity markets pulled back yesterday, as Oracle, another AI stock, dragged markets down. The AI dominance continues to disrupt markets positively and negatively, but investors have also turned their attention to the upcoming third-quarter earnings season. Another area of concern is the Fed, which has limited data to rely on for its next interest rate decision as the government shutdown continues. Markets hope for another 25-basis-point interest rate cut, a healthy earnings season, and validation from AI stocks, but could find disappointment on more than one front.
3M Company Fundamental Analysis
3M Company is an industrial conglomerate that supplies over 60,000 products to industrial clients, the transportation sector, electronics, worker safety, and consumer goods. It has over 100,000 patents.
So, why am I bearish on MMM following its breakdown?
While I applaud the initiatives the 3M Company has announced, I see higher input costs and a slowing economy overshadowing them. The negative earnings growth could accelerate and add fuel to a correction following its breakdown. Valuations are high compared to its industry peers, and the negative cash flow from operations is also a concern.
Metric | Value | Verdict |
P/E Ratio | 22.06 | Bullish |
P/B Ratio | 19.72 | Bearish |
PEG Ratio | 3.37 | Bearish |
Current Ratio | 1.72 | Bearish |
ROIC-WACC Ratio | Positive | Bullish |
3M Company Fundamental Analysis Snapshot
The price-to-earning (P/E) ratio of 22.06 makes MMM an expensive stock in its industry, but inexpensive compared to the S&P 500. By comparison, the P/E ratio for the S&P 500 is 30.29.
The average analyst price target for MMM is $162.81. It suggests negligible upside potential, with rising downside risks.
3M Company Technical Analysis
Today’s MMM Signal
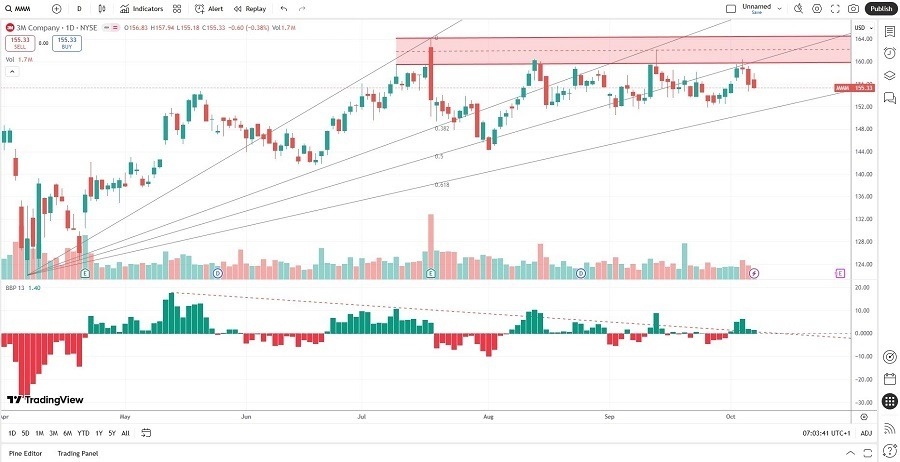
3M Price Chart
- The MMM D1 chart shows the horizontal resistance zone rejecting price action.
- It also shows price action between its ascending 31.8% and 50.0% Fibonacci Retracement Fan levels.
- The Bull Bear Power Indicator is bullish with a descending trendline and approaches a bearish crossover.
- The average bearish trading volumes are higher than the average bullish trading volumes.
- MMM stagnated as the S&P 500 recorded fresh all-time highs, a bearish trading signal.
Top Regulated Brokers
My Call on 3M
I am taking a short position in MMM between $155.18 and $159.47. The price-to-book and the PEG ratios confirm an overvalued stock with limited upside potential but magnified downside risks. Several operating metrics are trending in the wrong direction, and more downside is likely.
- MMM Entry Level: Between $155.18 and $159.47
- MMM Take Profit: Between $121.98 and $130.36
- MMM Stop Loss: Between $167.43 and $172.46
- Risk/Reward Ratio: 2.71
Ready to trade our daily stock signals? Here is our list of the best stock brokers worth reviewing.