BTC is up 7% from its local low of $103,600 reached on Oct. 17, shrugging off recent volatility, including a partial government shutdown that rattled broader markets.
With macroeconomic tailwinds aligning, onchain indicators flashing green, and technical charts painting a path to new highs, the narrative that the bull market is over seems unfounded.
Improving Macroeconomic Conditions: Tailwinds for Bitcoin
The improving macroeconomic conditions are aligning to propel Bitcoin higher. The US government shutdown, now in its third week, may be resolved soon, with House Speaker Mike Johnson signalling potential votes next week to end disruptions.
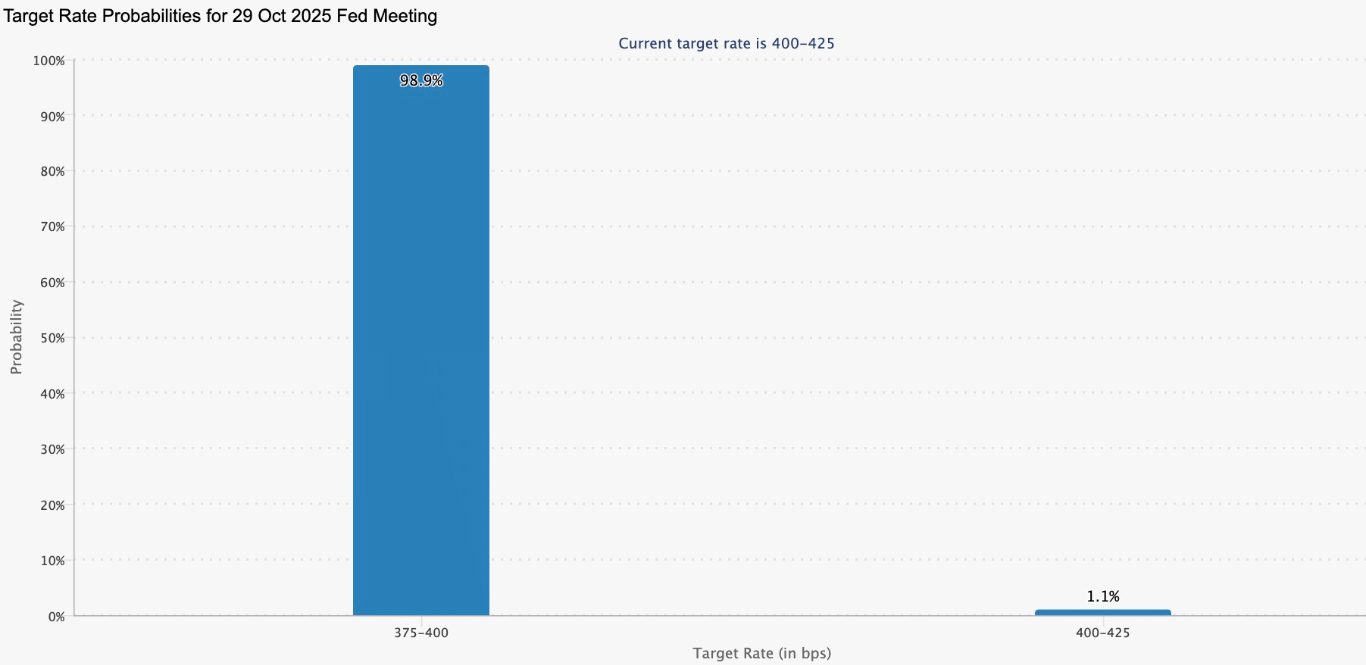
A deal would stabilize markets, boosting risk assets like cryptocurrencies, including Bitcoin. The Oct. 28-29 FOMC meeting carries a 99% chance of a 25-basis-point rate cut, according to the CME Group FedWatch tool, which would lower rates to 3.75%-4%.

Target rate possibilities at the October 29 FOMC meeting. Source: CME Group FedWatch tool
Meanwhile, Fed Chair Jerome Powell hinted at a possible end to quantitative tightening (QT) soon—potentially by January 2026. This could unleash liquidity, echoing the surge in 2021 crypto prices.
Additionally, BlackRock’s decision on its Ethereum staking ETF is pending as the October 30 approval deadline approaches. An approval could unlock institutional capital, potentially lifting BTC as the sector leader.
Meanwhile, President Trump’s confirmed summit with China’s Xi Jinping at APEC could ease trade war tensions, reducing safe-haven selling and supporting global growth.
These factors—shutdown resolution, rate cuts, QT wind-down, ETF catalysts, and geopolitical de-escalation—create a liquidity-rich environment. Bitcoin, historically a hedge against fiat debasement, thrives in such conditions, with ETF inflows and corporate adoption amplifying upside potential. The macro stage is set for BTC to climb further, potentially testing new highs by year-end.
Onchain Signals Suggest Bitcoin Bull Market is Not Done
Onchain data debunks claims of a bull market peak, signalling that Bitcoin has more room for further expansion into new all-time highs.
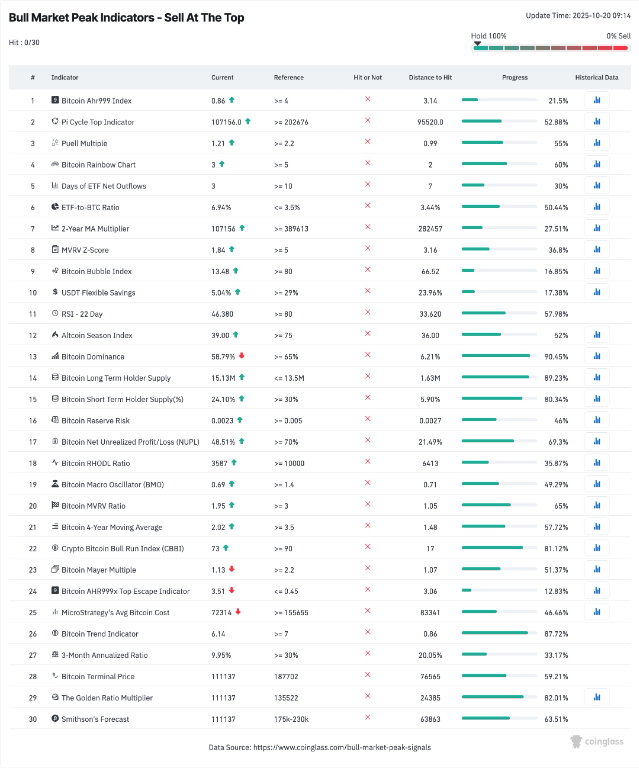
CoinGlass’ curated “bull market peak indicators” selection contains 30 potential selling triggers and aims to catch long-term BTC price tops. Currently, not a one of its components is flashing a top signal, with CoinGlass rating BTC a “hold 100%” asset.
For example, the Bitcoin AHR999 Index (currently at 0.86, well below its 4.0 trigger) and the Pi Cycle Top Indicator (107,156 vs. a 202,676 threshold). This dashboard, blending onchain metrics like MVRV Z-Score and RSI, underscores a market with “plenty of room to run,” per analysts tracking historical cycles.
The Crypto Bitcoin Bull Run Index (CBBI) similarly scores the cycle in its expansion phase, with confidence levels far from euphoric peaks seen in 2021. According to these models, the BTC/USD pair will peak within the $135,000 to $230,000 range this cycle.

Bitcoin’s bull market peak indicators. Source: CoinGlass
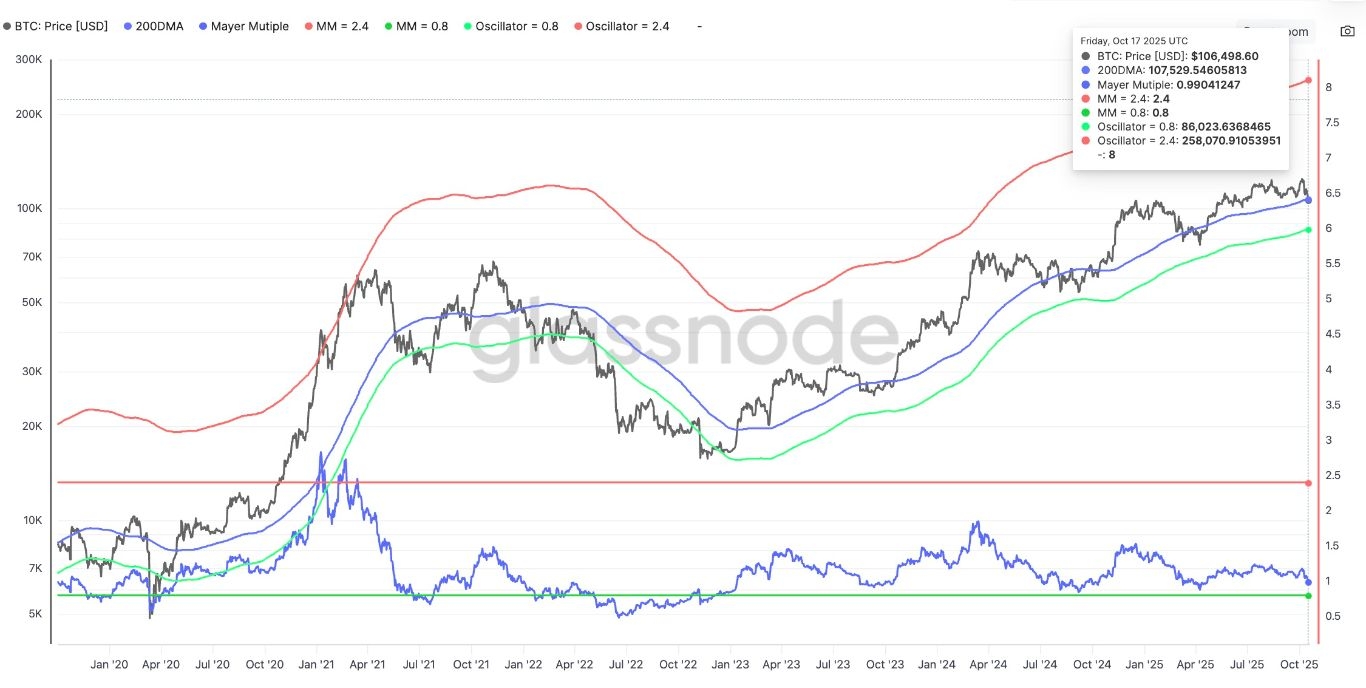
Meanwhile, the Mayer Multiple, an indicator used for measuring overbought conditions by dividing BTC’s price by its 200-day moving average, firmly points to bullish price continuation. At 1.13 with BTC at $110,000 against an approximately $100,000 average, it suggests that Bitcoin is trading in “undervalued” territory, below the 2.4 level that has preceded every prior top.
The Multiple has broadly cooled this bull cycle, compared to others before it, reaching a maximum level of 1.84 in March 2024. At the time, BTC/USD traded at around $72,000, per data from onchain analytics platform Glassnode.

Bitcoin Mayer Multiple. Source: Glassnode
The chart above indicates that for BTC/USD to reach the 2.4 mark, it would need to rise to $258,000.
October 2025 emerges as a consensus top target, but with profit-taking just beginning, we’re likely midway, not at the finish line. These tools aren’t infallible, but their unison chorus debunks top-calling fatigue, inviting sidelined capital to join the rally.
Bull Flags Targeting $190,000 BTC Price
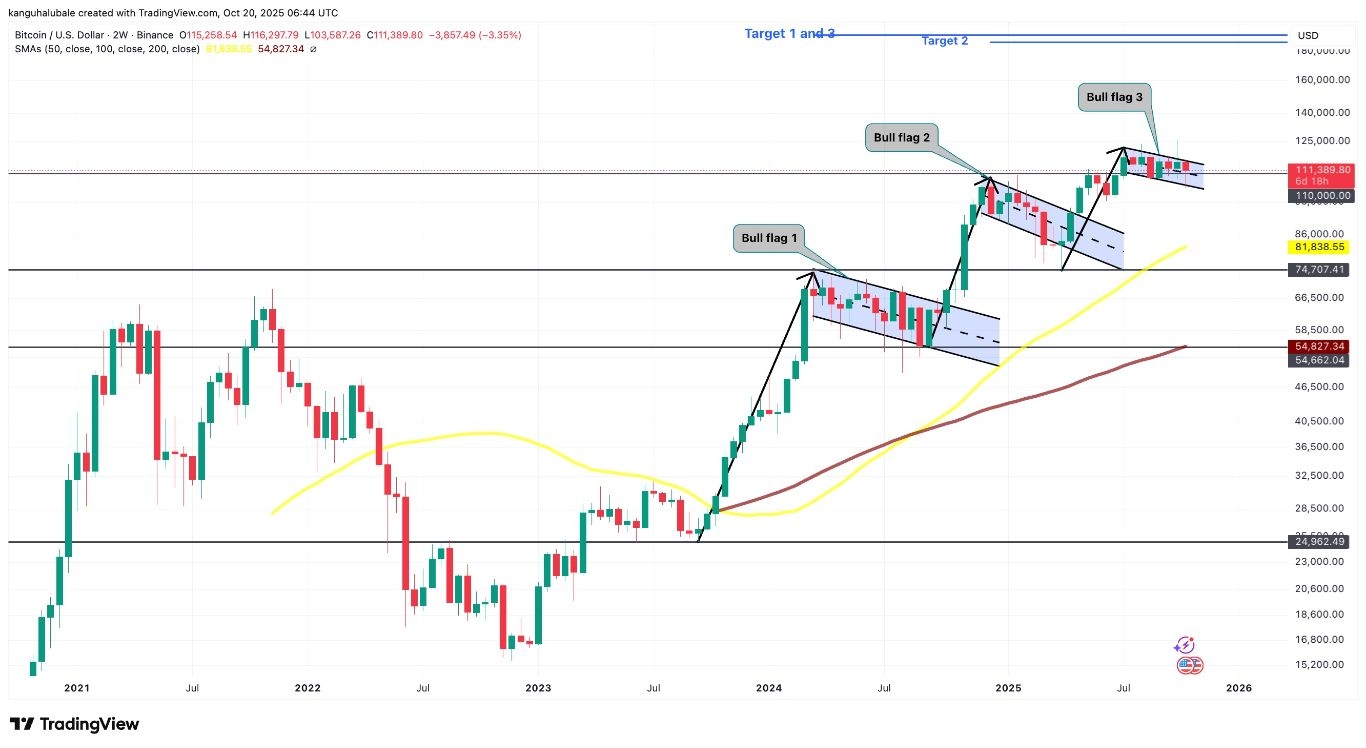
Zooming out to the macro canvas, Bitcoin's chart is a textbook bullish setup, with the 2-week time frame revealing multiple bull flags projecting higher targets for Bitcoin.
The first is a larger bull flag that formed between September 2023 and October 2024, as shown in the chart below. The flag was confirmed during the US election rally and is still in play at the time of writing. This flag has a measured target of $192,000.
The second bull flag formed between September 2024 and December 2024 and has a measure target of $186,000.
The third one is a smaller flag and has been in formation since March this year. It will be confirmed once the price breaks above the upper boundary of the flag at $115,000. Such a move would open the door for a rally toward the measured target of the flag at $192,000, coinciding with the target of the first flag.

BTC/USD two-week chart. Source: TradingView
However, bulls should hold firm support at the $108,000-$110,000 range to confirm the structure’s validity.
Ready to trade our technical analysis of Bitcoin? Here’s our list of the best MT4 crypto brokers worth checking out.
