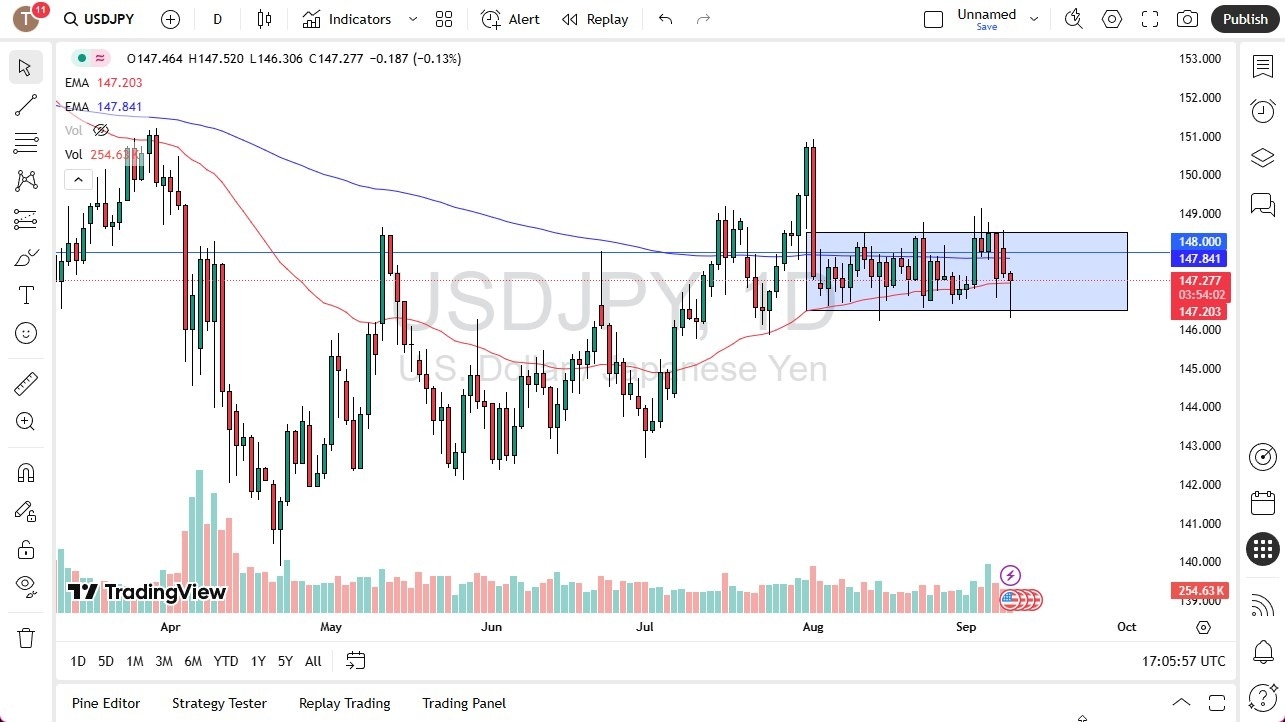
- The US dollar initially plunged during the trading session on Tuesday, testing the crucial ¥146.50 level.
- However, we have turned the market back around to show signs of life, and in fact, have broken back above the 50 Day EMA.
- In other words, it looks like the market is going to try to recover and stay within the previous consolidation area. If we end up forming a hammer, a lot of technical traders will watch that very closely.
Technical Analysis
The technical analysis for this market remains somewhat flat, and we are hanging around the 50 Day EMA. All things being equal, this is a market that I think continues to see the pair dance around in the same consolidation area that we have been in before. The market is of course paying close attention to the Federal Reserve meeting next Thursday, and therefore I think you’ve got a situation where we are in a little bit of a “holding pattern.”
Top Regulated Brokers
The 50 Day EMA is flat, and then again you have the 200 Day EMA sitting just below the ¥148 level. All things being equal, it does make a certain amount of sense that the market could just kill sometime between now and the September 17 session. Ultimately, I think this is a scenario where we will see quite a bit of choppiness, but I think we still see a lot of buyers on dips, as the market continues to favor the US dollar at least at the end of the day, as the swap is certainly positive.
If we were to break down below the ¥146 level, then we could see this market plunging toward the ¥143 level. If we were to break above the ¥148.50 level, then it’s possible that the market could go looking to the ¥151 level. Ultimately, I do favor the upside but I think the next couple of weeks could be very choppy and sideways overall.
Want to trade our USD/JPY forex analysis and predictions? Here's a list of forex brokers in Japan to check out.

