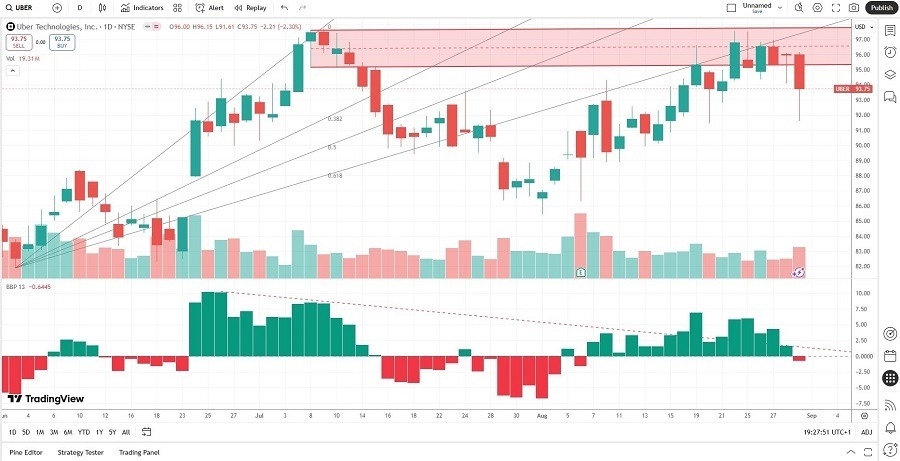
Short Trade Idea
Enter your short position between 91.61 (Friday’s intra-day low) and 96.15 (Friday’s intra-day high).
Market Index Analysis
- Uber Technologies (UBER) is a member of the S&P 500.
- This index trades near records, but technical breakdown signals are rising.
- The Bull Bear Power Indicator of the S&P 500 shows a negative divergence.
Market Sentiment Analysis
This week’s focus remains on the US August NFP report following a dismal July report. Uncertainty about the composition of the Federal Reserve’s Board of Governors and the risk of the Fed’s independence will equally weigh on sentiment. Manufacturing data and other employment data could inject volatility. Retailers have warned that the worst of the tariff impact is still ahead, and earnings calls have noted tariff impacts ahead from seven of the eleven sectors in the S&P 500.
Uber Technologies Fundamental Analysis
Uber Technologies is the world’s largest ridesharing company with over 150 million monthly users and six million drivers. It is a controversial and disruptive company with excellent profit margins, but high debt levels and balance sheet issues.
So, why am I bearish on UBER after its breakdown?
UBER increases its share count, destroys shareholder value, and struggles with balance sheet uncertainty. Depressed consumer confidence and less disposable income could pressure profit margins in the third and fourth quarters. Its PEG ratio suggests overvalued shares, and top-line growth moderates. I believe more down side will follow, which will adjust its share price to economic reality.

Uber Technologies Fundamental Analysis Snapshot
The price-to-earnings (P/E) ratio of 35.23 makes UBER an inexpensive stock. By comparison, the P/E ratio for the S&P 500 is 30.01.
The average analyst price target for UBER is 106.14. It suggests reasonable upside potential, but outsized downside risks.
Uber Technologies Technical Analysis
Today’s UBER Signal

Uber Technologies Price Chart
- The UBER D1 chart shows a price action completing a breakdown below its horizontal resistance zone.
- It also shows price action trading below its ascending 61.8% Fibonacci Retracement Fan levels.
- The Bull Bear Power Indicator is bearish with a descending trendline.
- The average bearish trading volumes have increased during the breakdown.
- UBER struggled with the NASDAQ 100 to maintain upward momentum, a bearish trading signal.
My Call on Uber Technologies
I am taking a short position in UBER between 91.61 and 96.15. The PEG ratio suggests high valuations, and the shareholder value destruction stands out. I am also concerned about profit margins in the second half of this year, as top-line growth is losing momentum. I see more downside ahead following the breakdown.
- UBER Entry Level: Between 91.61 and 96.15
- UBER Take Profit: Between 77.58 and 80.12
- UBER Stop Loss: Between 97.72 and 99.67
- Risk/Reward Ratio: 2.30
Ready to trade our free daily signals? Here is our list of the best brokers for trading worth checking out.
