With Federal Reserve rate cuts looming and Solana ETF approval odds soaring, SOL’s rise into “price discovery” territory is undeniable.
Top Regulated Brokers
Fed Rate Cut Odds at 100%
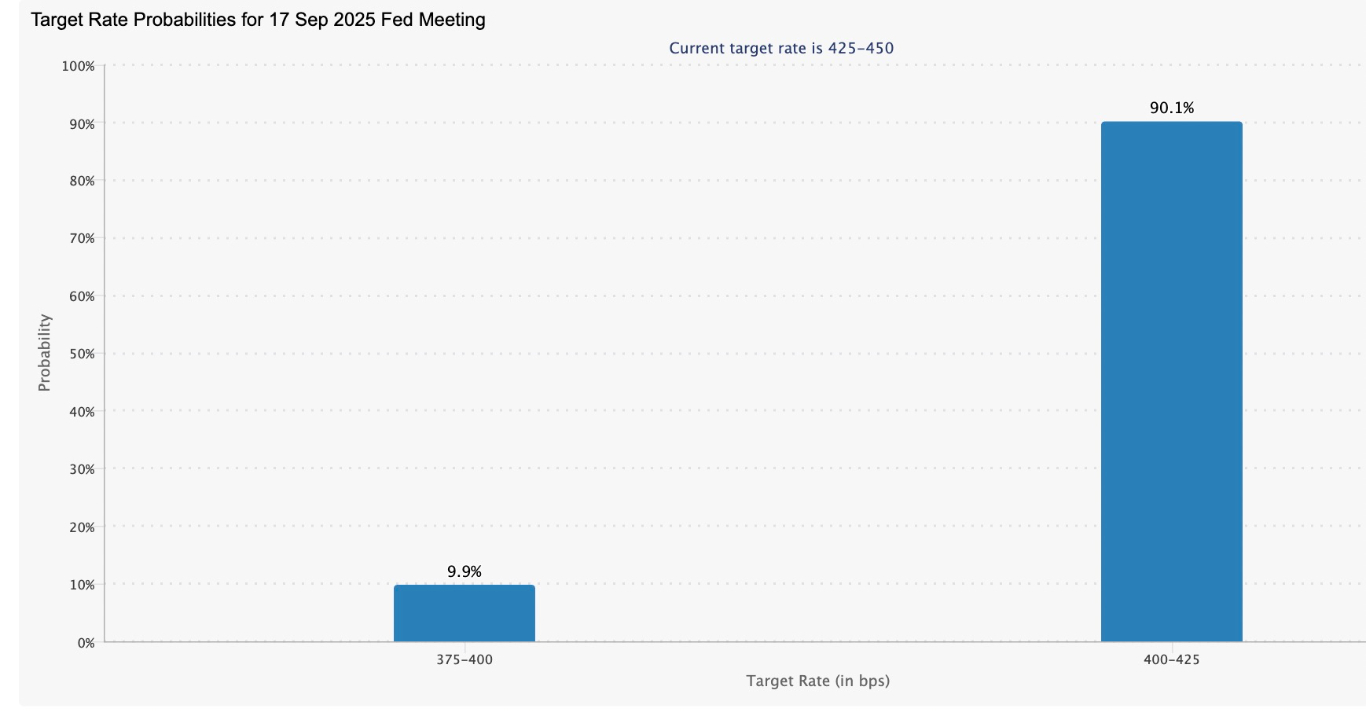
The Federal Reserve’s September 17, 2025, FOMC meeting has markets on edge, with traders pricing in a 100% probability of an interest rate cut, per CME’s FedWatch tool.
A 25-basis-point cut is most likely, although markets perceive a 10% chance of a 50-basis-point cut, which signals aggressive easing expectations.
 Target rate possibilities for Sept. 17 FOMC meeting. Source: CME Group
“Rate cut is 100% confirmed,” said entrepreneur Smooth Rey in an X post on Sunday, adding that the futures markets are now anticipating rate cuts in each of the next three Fed meetings (Sept, October and December)!
“The lower the dollar, the better for us investors as crypto/foreign currencies will go up/strengthen worldwide.”
Lower interest rates reduce borrowing costs, weaken the US dollar, and boost risk assets like cryptocurrencies.
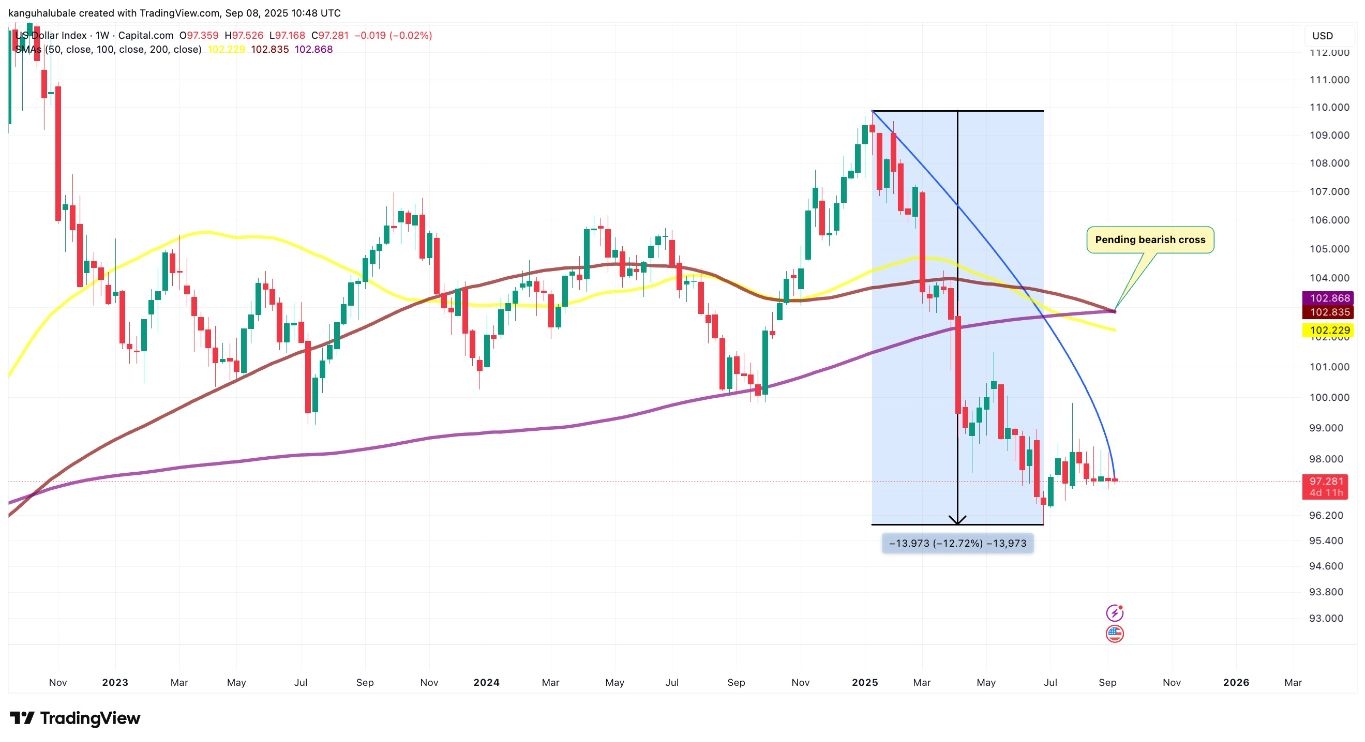
Meanwhile, the US dollar index has dropped sharply from 109.89 in December 2024 to a multiyear low of 95.9 in June, signaling a weakening US economy.
 DXY weekly chart. Source: TradingView
The chart above shows a bearish cross from the moving averages when the 100-weekly SMA crossed below the 200-day SMA, suggesting that a further drop in DXY was imminent.
A decreasing US dollar boosts investor appetite for risk assets, enhancing liquidity and driving capital into high-growth markets like blockchain.
Increased liquidity often amplifies SOL’s price gains, as seen in past cycles where loose monetary policy drove crypto rallies. If the Fed signals further cuts later in the year, SOL could see sustained buying pressure, potentially pushing it toward $240 in the near term, a stepping-stone to $600.
However, sticky inflation (core PCE at 2.9%) could temper expectations if the Fed adopts a cautious stance. Still, the current consensus points to a bullish macro setup for Solana.
Spot SOL ETF Approval Odds Hit 100% on Polymarket
Increased institutional adoption could add to the tailwind needed to boost Solana into price discovery.
Public companies are increasingly adopting Solana as a treasury reserve asset, with Upexi Inc. boosting its SOL holdings by 172% in July, reaching 2 million tokens ($430 million), staking for 8% yield.
DeFi Development Corp. holds a total of 1.99 million SOL ($427 million), focusing on DeFi integration.
Sol Strategies, now Nasdaq-listed (STKE), holds 370,420 SOL ($79 million), emphasizing validator operations.
 Solana Treasury holdings. Source: CoinGecko
Meanwhile, Sharps Technology raised $400M for SOL purchases, aiming for $1B.
These firms leverage Solana’s speed and staking rewards, aligning with its growing DeFi ecosystem, though volatility and regulatory risks persist.
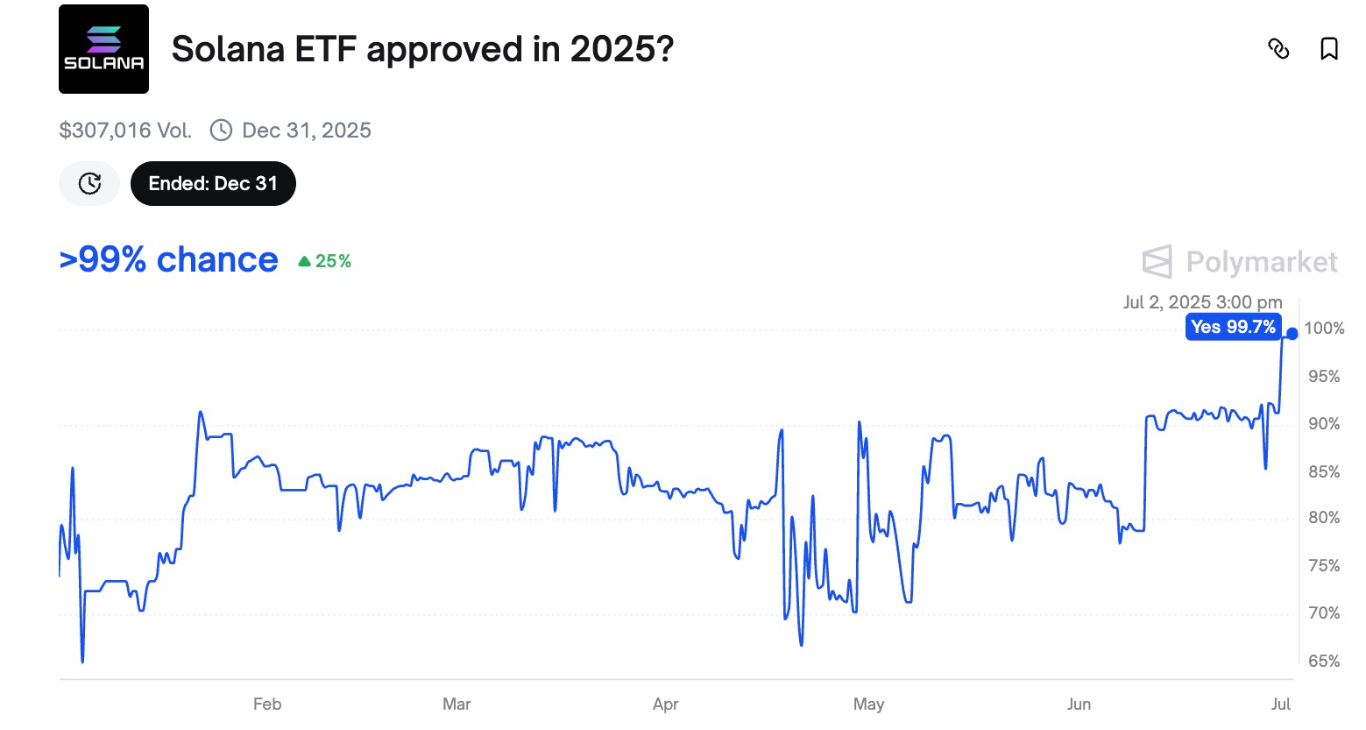
With spot Solana ETF approval odds now at 100% on Polymarket, it is a reflection of strong market confidence. This follows filings from major players like VanEck, 21Shares, and Fidelity, with the SEC requesting updated S-1 filings, some including staking features.
 Spot Solana ETF approval odds for 2025. Source: Polymarket
A Solana ETF would open the door to institutional capital, mirroring the success so far seen with Bitcoin and Ethereum ETFs. Solana’s high yield-staking (up to 6% APR on platforms like Binance) could make it more attractive.
SOL’s U-Shaped Pattern Targets $680
Solana’s price chart displays a strong rounded bottom pattern, a bullish setup forming since 2025 on the weekly chart, as shown below.
A rounded bottom pattern signifies a reversal from a long-term downtrend to a potential uptrend. This bullish pattern is characterized by a gradual price decline followed by a slow, U-shaped recovery with increasing bullish momentum, often confirmed by increasing trading volume as the price breaks out of the pattern’s resistance level.
Solana bulls are now focused on pushing the price above the neckline of the prevailing chart pattern at $255 to confirm a breakout. If this happens, it will open the way for a rally to the technical target of the prevailing chart pattern at $680, or a 219% increase from the current price.

“Nearly two years of preparation,” said popular crypto analyst Jelle, spotting a similar setup in a chart analysis on X, adding:
“SOL looks ready for price discovery. Bring on $600.”
The weekly chart shows the price moving above all the major moving averages, indicating strong support on the downside. The Relative Strength Index (RSI) has increased from 36 in April to 61 at the time of writing, indicating steadily increasing momentum with room for growth before overbought conditions.
However, a failure to hold $200 could trigger a retest of $177, where the 50-weekly SMA currently sits, though historical September gains (12.5%-29%) bolster confidence.
With the Alpenglow upgrade enhancing Solana’s throughput to 100,000 TPS, technical and fundamental factors align for a $600 target.
Ready to trade our technical analyses of Solana? Here’s our list of the best MT4 crypto brokers worth reviewing.
