Short Trade Idea
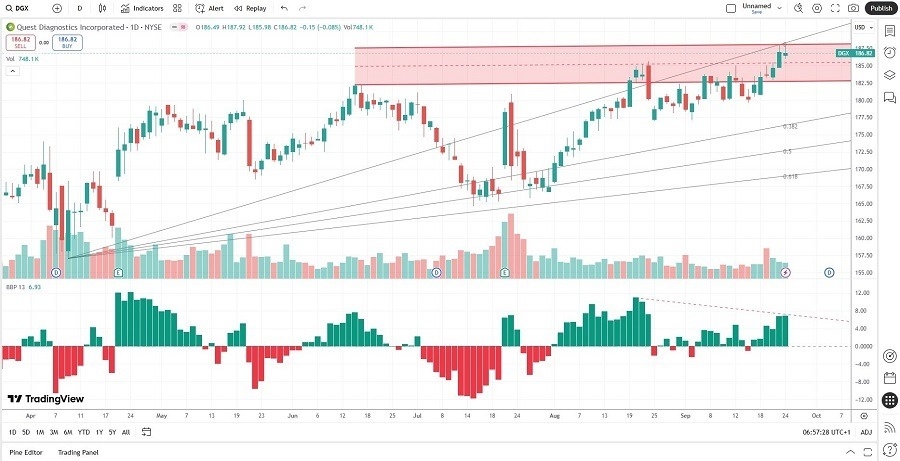
Enter your short position between $185.00 (the intra-day high of its last bearish candlestick) and $187.92 (the upper band of its horizontal resistance zone).
Market Index Analysis
- Quest Diagnostics (DGX) is a member of the S&P 500.
- This index shows a bearish chart pattern, and breakdown indicators have increased.
- The Bull Bear Power Indicator for the S&P 500 shows a negative divergence and does not confirm the uptrend.
Market Sentiment Analysis
Equity markets faced a second day of modest selling yesterday, as investors assessed the next directional catalysts. Today’s PCE component of the GDP report should receive less attention than tomorrow’s PCE data, the Federal Reserve’s preferred inflation gauge, released as part of the personal income and spending report. Today’s session could extend the two-day sell-off, especially if markets receive weak labor data, with tomorrow’s consumer confidence data possibly extending this week’s sell-off.
Quest Diagnostics Fundamental Analysis
Quest Diagnostics is a clinical laboratory that offers diagnostic testing services for cancer, cardiovascular disease, infectious disease, neurological disorders, COVID-19, and employment and court-ordered drug testing.
So, why am I bearish on DGX following its double-digit rally?
Quest Diagnostics shows some concerning trends hidden in otherwise healthy stats. The multi-year contraction in profit margins and the simultaneous rise in its debt-to-equity ratio are red flags. While its valuations are approaching expensive status, the dividend yield is average, and the earnings per share growth is meager. The sum of all parts does not warrant the current share price, which trades near the average analyst’s estimate.
Quest Diagnostics Fundamental Analysis Snapshot
The price-to-earnings (P/E) ratio of 22.37 makes DGX an inexpensive stock. By comparison, the P/E ratio for the S&P 500 is 29.76.
The average analyst price target for DGX is $188.19. It suggests no mentionable upside potential, while downside risks have magnified.
Quest Diagnostics Technical Analysis
Today’s DGX Signal
Quest Diagnostics Price Chart
- The DGX D1 chart shows price action inside its horizontal resistance zone.
- It also shows price action trading between its ascending 0.0% and 38.2% Fibonacci Retracement Fan.
- The Bull Bear Power Indicator is bullish but shows a negative divergence.
- The average bearish trading volumes are higher than the average bullish trading volumes, and the most recent rally came on below average trading volumes.
- DGX advanced with the S&P 500, a bullish confirmation, but breakdown indicators have emerged.
My Call on Quest Diagnostics
I am taking a short position in DGX between $185.00 and $187.92. Quest Diagnostics advanced while its profit margins contracted, and its debt levels rose. I believe the disconnect will soon experience a mean reversion, especially if the AI bubble bursts, which will drive risk assets lower.
- DGX Entry Level: Between $185.00 and $187.92
- DGX Take Profit: Between $164.65 and $168.46
- DGX Stop Loss: Between $191.72 and $197.47
- Risk/Reward Ratio: 3.03
Ready to trade our free stock signals? Here is our list of the best stock brokers worth checking out.


