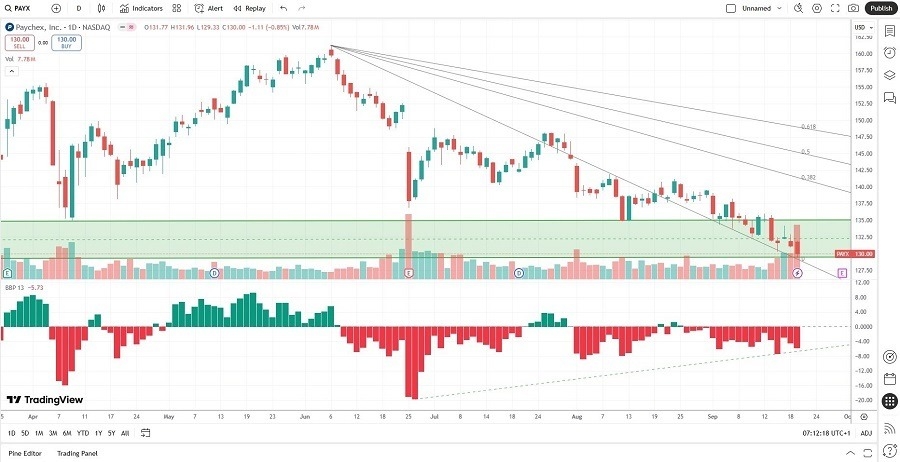
Long Trade Idea
Enter your long position between $128.92 (the lower band of its horizontal support zone) and $134.14 (the intra-day high of its last bullish candlestick).
Market Index Analysis
- Paychex (PAYX) is a member of the NASDAQ 100 and the S&P 500.
- Both indices trade near record highs driven by the AI hype, but breakdown indicators continue to accumulate.
- The Bull Bear Power Indicator for the S&P 500 shows a negative divergence and does not confirm the uptrend.
Market Sentiment Analysis
After Wall Street received its much-anticipated interest rate cut, with a prediction for two more in 2025 but only one in 2026, markets wonder what will happen next. The massive tech-led rally in September, historically one of the worst months for equities, resembles a melt-up, which usually precedes a market correction or crash. The third-quarter earnings season is approaching, and markets should revert to a data-dependent environment for direction, focused on labor market and inflation data.
Paychex Fundamental Analysis
Paychex is a human resources, payroll, and employee benefits company focused on small- to medium-sized businesses. It has over 100 offices and serves over 740,000 clients across the US and Europe.
So, why am I bullish on PAYX despite its double-digit correction?
Labor market weakness has raised concerns, but the outlook for Paychex suggests an acceleration from its three-year sales trend. I like the free cash flow generation at PAYX, which should allow it to weather the storm. The recent correction dropped its share price into reasonable valuations, and the PEG ratio suggests an undervalued stock.
Metric | Value | Verdict |
P/E Ratio | 28.38 | Bullish |
P/B Ratio | 11.32 | Bearish |
PEG Ratio | 2.30 | Bullish |
Current Ratio | 1.28 | Bearish |
ROIC-WACC Ratio | Positive | Bullish |
The price-to-earning (P/E) ratio of 28.38 makes PAYX a reasonably priced stock. By comparison, the P/E ratio for the S&P 500 is 29.65.
The average analyst price target for PAYX is $145.92. It suggests moderate upside potential, with acceptable downside risks.
Paychex Technical Analysis
Today’s PAYX Signal

- The PAYX D1 chart shows price action inside its horizontal support zone.
- It also shows price action trading between its descending 0.0% and 38.2% Fibonacci Retracement Fan.
- The Bull Bear Power Indicator is bearish but shows a positive divergence.
- The average bearish trading volumes are higher than the average bullish trading volumes but are nearing a washout.
- PAYX moved lower while the S&P 500 Index set a fresh all-time high, a bearish signal, but reversal signals are accumulating.
My Call on Paychex
I am taking a long position in PAYX between $128.92 and $134.14. Healthy operational statistics, a PEG ratio that suggests an undervalued stock, and current support levels create ideal conditions for a price action reversal. The dividend yield compensates investors for short-term volatility.
- PAYX Entry Level: Between $128.92 and $134.14
- PAYX Take Profit: Between $157.01 and $161.24
- PAYX Stop Loss: Between $115.54 and $120.14
- Risk/Reward Ratio: 2.10
Ready to trade our daily signals on stocks? Here is our list of the best brokers for trading worth checking out.
