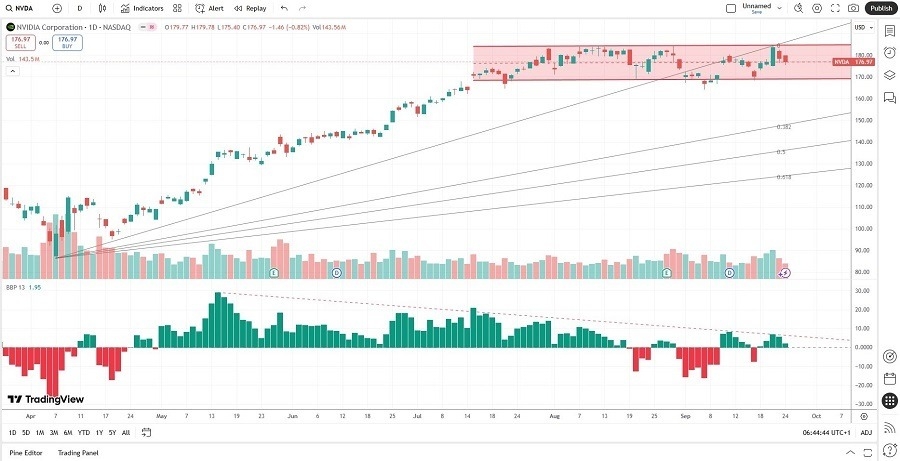
Short Trade Idea
Enter your short position between $174.71 (the intra-day low of its last bullish candlestick) and $184.55 (the upper band of its horizontal resistance zone).
Market Index Analysis
- NVIDIA (NVDA) is a member of the NASDAQ 100, the Dow Jones Industrial Average, the S&P 100, and the S&P 500.
- All four indices show bearish chart patterns, and breakdown indicators have increased.
- The Bull Bear Power Indicator for the NASDAQ 100 shows a negative divergence and does not confirm the uptrend.
Market Sentiment Analysis
Equity markets faced a second day of modest selling yesterday, as investors assessed the next directional catalysts. Today’s PCE component of the GDP report should receive less attention than tomorrow’s PCE data, the Federal Reserve’s preferred inflation gauge, released as part of the personal income and spending report. Today’s session could extend the two-day sell-off, especially if markets receive weak labor data, with tomorrow’s consumer confidence data possibly extending this week’s sell-off.
NVIDIA Fundamental Analysis
NVIDIA is a semiconductor company that emerged as the leading AI company. Originally catering to gamers with high-end GPUs, it broadened into AI, and its tremendous success made it the first company to reach a $4 trillion market cap.
So, why am I bearish on NVDA despite its leadership position in AI?
While I like the long-term potential for NVIDIA, I am cautious on the short-term outlook, including its next earnings release. NVDA will miss out on China, at least in the medium term. Huawei has announced a cluster that outperforms the best NVDA has to offer at lower costs, and NVDA continues to have massive capital outflows, which could disappoint investors amid a projected earnings shortfall.
NVIDIA Fundamental Analysis Snapshot
The price-to-earnings (P/E) ratio of 50.56 makes NVDA an expensive stock. By comparison, the P/E ratio for the NASDAQ 100 is 33.08.
The average analyst price target for NVDA is $212.47. It suggests reasonable upside potential, but medium-term downside risks have emerged.
NVIDIA Technical Analysis
Today’s NVDA Signal
Nvidia Price Chart
- The NVDA D1 chart shows price action inside its horizontal resistance zone.
- It also shows price action trading between its ascending 0.0% and 38.2% Fibonacci Retracement Fan.
- The Bull Bear Power Indicator is bullish, but shows a negative divergence, and is approaching a bearish crossover.
- The average bearish trading volumes are higher than the average bullish trading volumes.
- NVDA stagnated as the NASDAQ 100 pushed higher, a bearish development.
My Call on Nvidia
I am taking a short position in NVDA between $174.71 and $184.55. NVIDIA has excellent long-term potential as a core AI player, but today, medium-term risks outweigh it. A bursting of the AI bubble, led by a revenue shortfall, and the exclusion from China pose notable headwinds for NVIDIA.
- NVDA Entry Level: Between $174.71 and $184.55
- NVDA Take Profit: Between $143.44 and $153.13
- NVDA Stop Loss: Between $190.09 and $198.51
- Risk/Reward Ratio: 2.03
Ready to trade our free stock signals? Here is our list of the best stock brokers worth checking out.


