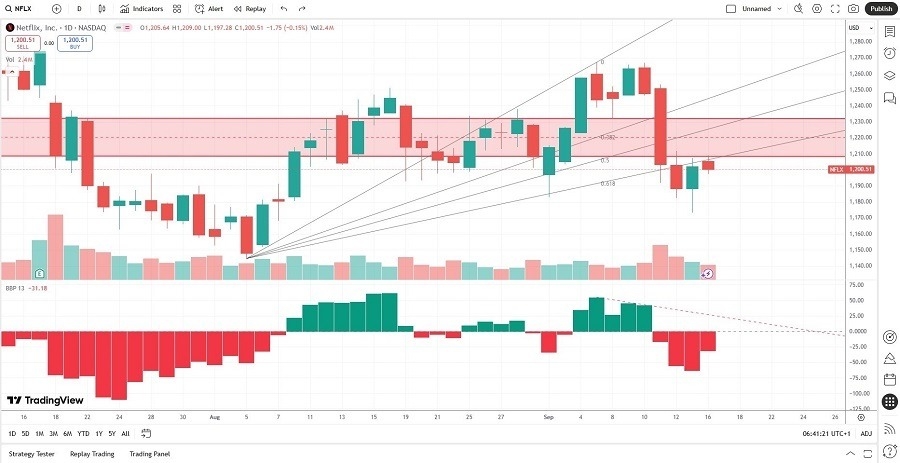
Short Trade Idea
Enter your short position between $1,173.21 (the intra-day low of its last bullish candle) and $1,209.24 (the lower band of its horizontal resistance zone).
Market Index Analysis
- Netflix (NFLX) is a member of the NASDAQ 100, the S&P 100, and the S&P 500.
- All three indices hover near all-time highs with contracting trading volumes.
- The Bull Bear Power Indicator for the NASDAQ 100 shows a negative divergence and does not confirm the uptrend.
Market Sentiment Analysis
Equity futures traded in and out of positive territory ahead of today’s FOMC announcement, where expectations call for a 25-basis point interest rate cut. Equity markets move higher based on that assumption, but the bigger question is what will follow. June’s Dot-Plot Chart showed consensus for two interest rate reductions in the second half of 2025, but will the Fed stick to it amid inflation concerns, or will it cave to pressure from the White House? Volatility is likely to surge if the Fed statement disappoints investors.
Netflix Fundamental Analysis
Netflix is the best-known over-the-top subscription video-on-demand service. It has its own production studios, acquires original programming, and showcases third-party content via its subscription-based streaming services. It also expanded into gaming and love sporting events.
So, why am I bearish on NFLX following its breakdown?
While Netflix has impressive operational statistics and performance metrics, except for gross margins and current ratio, the departure of its Chief Product Officer has changed the investment narrative in the medium term. The Chief Technology Officer taking over as an interim stopgap does not instill confidence. I am also concerned about rising content costs, which are likely to outpace revenue and subscriber growth.
Netflix Fundamental Analysis Snapshot
The price-to-earnings (P/E) ratio of 51.02 makes NFLX an expensive stock. By comparison, the P/E ratio for the NASDAQ 100 is 38.56.
The average analyst price target for NFLX is $1,350.32. It suggests moderate upside potential, but medium-term downside risks remain elevated.
Netflix Technical Analysis
Today’s NFLX Signal
Netflix Price Chart
- The NFLX D1 chart shows price action breaking down below its horizontal resistance zone.
- It also shows price action breaking down below its ascending Fibonacci Retracement Fan.
- The Bull Bear Power Indicator is bearish with a descending trendline.
- The average bearish trading volumes are higher than the average bullish trading volumes.
- NFLX broke down as the NASDAQ 100 recorded all-time highs, a significant bearish signal.
My Call on Netflix
I am taking a short position in NFLX between $1,173.21 and $1,209.24. The departure of its Chief Product Officer has left a massive question mark on the medium-term outlook for Netflix. High content costs pose a threat, and I am selling the breakdown amid uncertainty about future subscriber growth.
Top Regulated Brokers
- NFLX Entry Level: Between $1,173.21 and $1,209.24
- NFLX Take Profit: Between $916.40 and $941.75
- NFLX Stop Loss: Between $1,267.10 and $1,302.26
- Risk/Reward Ratio: 2.74
Ready to trade our daily signals on stocks? Here is our list of the best brokers for trading worth reviewing.


