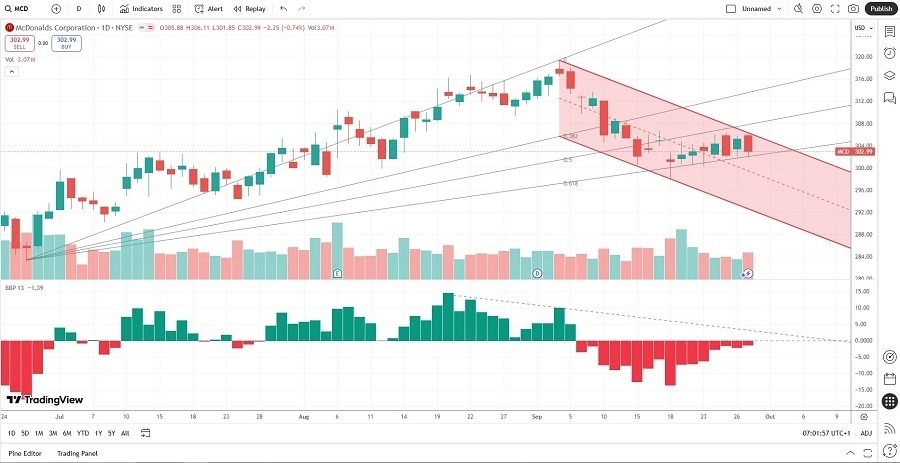
Short Trade Idea
Enter your short position between $301.85 (yesterday’s intra-day low) and $306.11 (yesterday’s intra-day high and upper band of its bearish price channel).
Market Index Analysis
- McDonald’s (MCD) is a member of the Dow Jones Industrial Average, the S&P 100, and the S&P 500.
- All three indices grind higher on the back of AI, with underlying bearish factors accumulating.
- The Bull Bear Power Indicator of the S&P 500 shows a negative divergence and does not support the uptrend.
Market Sentiment Analysis
Equity markets had a lackluster start to the trading week, extending a slow grind higher on the back of NVIDIA and AI. Futures suggest a slow start, as investors grapple with the potential of a brief government shutdown that would disrupt the release of Friday’s September NFP report. Following the much-anticipated 25-basis-point interest rate cut earlier this month, a slew of economic data cast a shadow of doubt over the two interest rate cuts that a slim majority of FOMC voting members predicted.
McDonald’s Fundamental Analysis
McDonald’s is a fast-food chain with the second-largest number of locations globally. It is also a significant real estate owner and investor, and the second-largest private employer with over 1.7 million employees.
So, why am I bearish on MCD after last week’s upward drift?
While the profit margins are excellent, they failed to stem the current sell-off and rise in bearish sentiment. Low-income diners face struggles, and more casual diners opt for healthier options. The reintroduction of its once-popular Monopoly game is now restricted to registered users of its mobile app for a limited time, suggesting MCD has no fresh ideas to attract foot traffic.
McDonald’s Fundamental Analysis Snapshot
The price-to-earning (P/E) ratio of 26.19 makes MCD an expensive stock. By comparison, the P/E ratio for the S&P 500 is 29.70.
The average analyst price target for MCD is $333.00. It points towards moderate upside potential, but downside risks continue to dominate.
McDonald’s Technical Analysis
Today’s MCD Signal
- The MCD D1 chart shows price action inside a bearish price channel.
- It also shows price action between its descending 50.0% and 61.8% Fibonacci Retracement Fan levels.
- The Bull Bear Power Indicator is bearish with a descending trendline.
- The average trading volumes during bearish trading sessions are higher than during bullish trading sessions.
- MCD corrected as the S&P 500 rallied to fresh highs, a significant bearish trading signal.
My Call on McDonald’s
I am taking a short position in MCD between $301.85 and $306.11. Valuations are high, and downside pressures on revenues are rising. MCD must invest heavily in marketing, where it currently lacks ideas, or rely on discounts to attract foot traffic. I see more downside ahead.
- MCD Entry Level: Between $301.85 and $306.11
- MCD Take Profit: Between $265.33 and $271.99
- MCD Stop Loss: Between $319.43 and $333.00
- Risk/Reward Ratio: 2.08
Ready to trade our free stock signals? Here is our list of the best stock brokers worth reviewing.


