
Long Trade Idea
Enter your long position between $190.71 (the lower band of its horizontal support zone) and $213.40 (the upper band of its horizontal support zone).
Market Index Analysis
- Honeywell International (HON) is a member of the Dow Jones Industrial Average, NASDAQ 100, S&P 100, and S&P 500 indices.
- All four indices trade near record highs driven by the AI hype, but breakdown indicators continue to accumulate.
- The Bull Bear Power Indicator for the S&P 500 shows a negative divergence and does not confirm the uptrend.
Market Sentiment Analysis
After Wall Street received its much-anticipated interest rate cut, with a prediction for two more in 2025 but only one in 2026, markets wonder what will happen next. The massive tech-led rally in September, historically one of the worst months for equities, resembles a melt-up, which usually precedes a market correction or crash. The third-quarter earnings season is approaching, and markets should revert to a data-dependent environment for direction, focused on labor market and inflation data.
Honeywell International Fundamental Analysis
Honeywell International is a conglomerate with aerospace, building automation, industrial automation, and energy and sustainability solutions (ESS) at its core. Additionally, it operates Sandia National Laboratories and has a global workforce of over 100,000 employees.
So, why am I bullish on HON following its post-earnings sell-off?
I am buying the pending split into three publicly traded companies to unlock shareholder value. HON will also benefit from increased defense spending and from the domestic manufacturing uptick, especially in data centers. I rank HON among the best manufacturing stocks and consider further downside from current levels as an excellent long-term buying opportunity.
Metric | Value | Verdict |
P/E Ratio | 23.82 | Bullish |
P/B Ratio | 8.26 | Bearish |
PEG Ratio | 1.81 | Bullish |
Current Ratio | 1.29 | Bearish |
ROIC-WACC Ratio | Positive | Bullish |
The price-to-earnings (P/E) ratio of 23.82 makes HON an inexpensive stock. By comparison, the P/E ratio for the S&P 500 is 29.65.
The average analyst price target for HON is $252.97. This suggests good upside potential, with manageable downside risks.
Honeywell International Technical Analysis
Today’s HON Signal
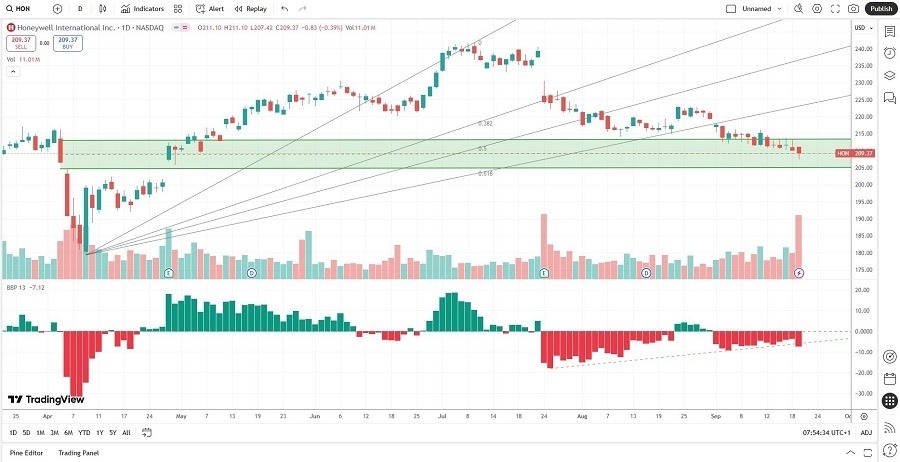
- The HON D1 chart shows price action inside its horizontal support zone.
- It also shows price action below its ascending Fibonacci Retracement Fan, but at solid support levels.
- The Bull Bear Power Indicator is bearish but shows a positive divergence.
- The average bearish trading volumes are higher than the average bullish trading volumes but are nearing a washout.
- HON moved lower while the S&P 500 set a fresh all-time high, a bearish signal, but early signs of a price-action reversal have materialized.
My Call on Honeywell International
I am taking a long position in HON between $190.71 and $213.40. HON has industry-leading performance metrics and is an excellent defense and manufacturing company. Valuations are reasonably low following the correction, and I am buying the strong support levels of this undervalued stock.
- HON Entry Level: Between $190.71 and $213.40
- HON Take Profit: Between $239.58 and $252.97
- HON Stop Loss: Between $179.36 and $188.80
- Risk/Reward Ratio: 4.31
Ready to trade our daily signals on stocks? Here is our list of the best brokers for trading worth checking out.