
A business model that can thrive in the current tariff environment, a strong current ratio, and a fresh brand positioning that empowers buyers provide reasons to go long. Is it time to take delivery of a buy?
Long Trade Idea
Enter your long position between $56.17 (the mid-level of its horizontal support zone) and $58.56 (yesterday’s intra-day high).
Market Index Analysis
- CarMax (KMX) is a member of the S&P 500.
- This index grinds higher in a melt-up of prices, but downside risks accumulate.
- The Bull Bear Power Indicator for the S&P 500 shows a negative divergence and does not confirm the uptrend.
Market Sentiment Analysis
Equity markets continued to grind higher yesterday following a weak start, once again powered by NVIDIA and other AI-related stocks. Investors pour capital into the AI sector without consideration, as one estimate calls for a $2.0 trillion funding requirement by the end of the decade, with estimated revenues at $1.2 trillion, creating an $800 billion shortfall. The bubble continues to expand, and markets will face their most significant test on Friday, with the release of the Federal Reserve’s favored inflation gauge. Bullish sentiment prevails, but investors should remain cautious.
CarMax Fundamental Analysis
CarMax is the largest used vehicle retailer in the US. It operates two business units: CarMax Sales Operations and CarMax Auto Finance. Its multichannel platform supports online purchases and in-store purchases, with options for home vehicle delivery and contactless curbside pickup.
So, why am I bullish on KMX despite its one-month downtrend?
The rebranding of this used vehicle dealer, its financially sound balance sheet, and overall business model are primary reasons for my long position in CarMax. Tariffs on new cars will not impact this KMX, and consumers are likely to flock to quality used cars, where this company shines. Its price-to-book ratio represents quality downside protection, and its PEG ratio confirms KMX as an undervalued company.
Metric | Value | Verdict |
P/E Ratio | 16.05 | Bullish |
P/B Ratio | 1.39 | Bullish |
PEG Ratio | 0.54 | Bullish |
Current Ratio | 2.39 | Bullish |
ROIC-WACC Ratio | Negative | Bearish |
CarMax Fundamental Analysis Snapshot
The price-to-earnings (P/E) ratio of 16.05 makes KMX an inexpensive stock. By comparison, the P/E ratio for the S&P 500 is 29.65.
The average analyst price target for KMX is $81.44. It suggests good upside potential, with manageable downside risks.
CarMax Technical Analysis
Today’s KMX Signal
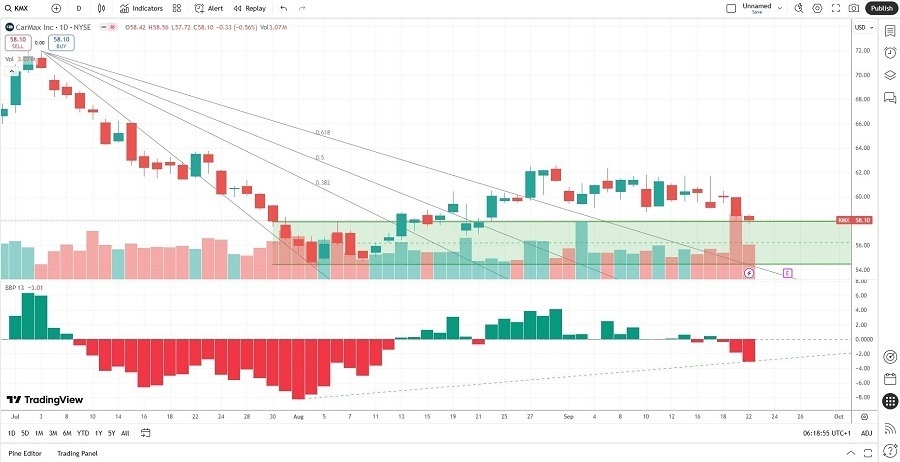
CarMax Price Chart
- The KMX D1 chart shows price action challenging the upper band of its horizontal support zone.
- It also shows price action breaking out above its descending Fibonacci Retracement Fan.
- The Bull Bear Power Indicator turned bearish but remains near its ascending support level.
- The average bullish trading volumes are higher than the average bearish trading volumes.
- KMX moved lower while the S&P 500 grinds higher, a bearish signal, but its breakout potential has increased.
My Call on CarMax
I am taking a long position in KMX between $56.17 and $58.56. I am buying into the rebranding, the price-to-book ratio, and the PEG ratio. Also, unlike many companies in the S&P 500, the current ratio is excellent, confirming a financially sound balance sheet.
- KMX Entry Level: Between $56.17 and $58.56
- KMX Take Profit: Between $71.99 and $75.99
- KMX Stop Loss: Between $51.83 and $52.89
- Risk/Reward Ratio: 3.65
Top Regulated Brokers
Ready to trade our daily stock market signals? Here is our list of the best brokers for trading worth reviewing.