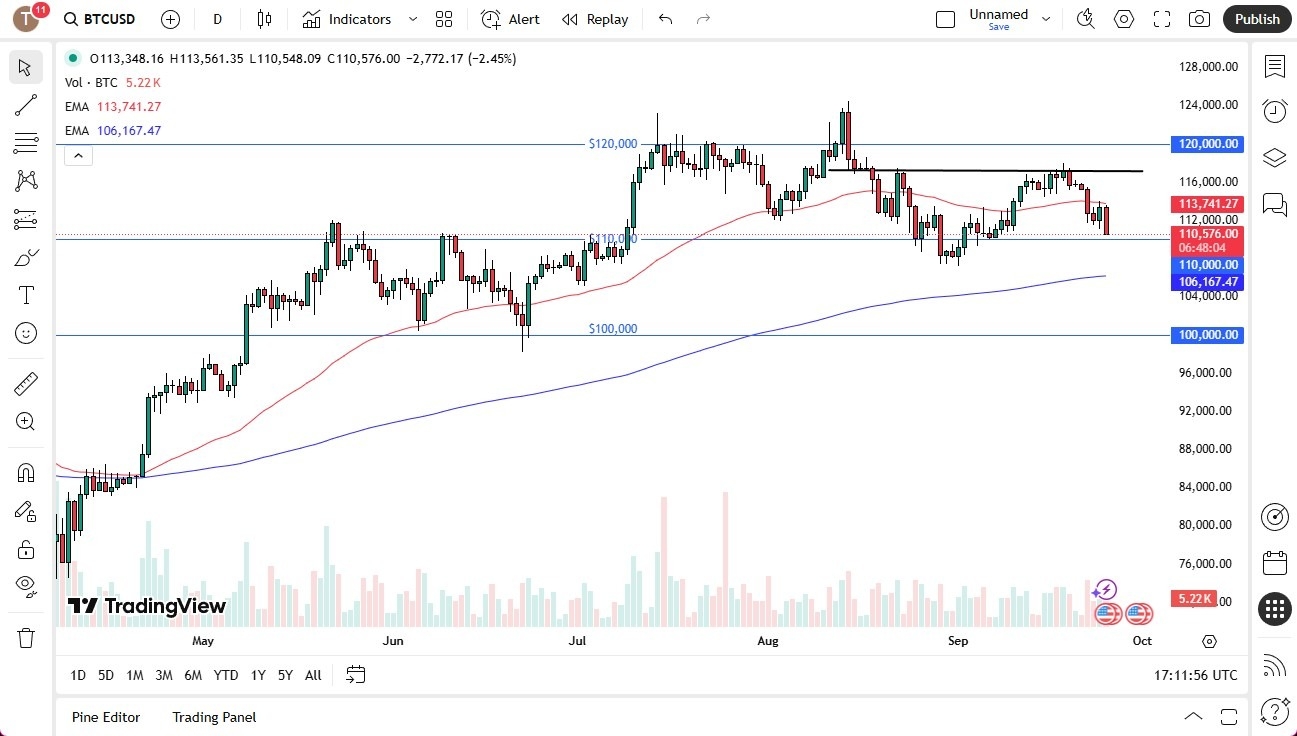
- Bitcoin fell significantly during the trading session on Thursday as we continue to see some risk appetite get hit.
- Furthermore, it’s probably worth noting that the US GDP numbers were much hotter than anticipated, so a lot of traders will be looking at this as a scenario where risk appetite starts to shrink because loose monetary policy may not be coming as aggressively as people had hoped for.
Technical Analysis
The technical analysis for this market is a bit flat recently, but we are starting to reach a significant support level, and perhaps more importantly, the 200 Day EMA which is near the $106,000 level. If we were to break down below there, then it’s possible that the market could go looking to the $100,000 level below, as it is an area that will attract a lot of headline attention.
Top Regulated Brokers
On the other hand, if we were to turn around and rally at this point in time, a move above the 50 Day EMA, basically the top of the candlestick for the session on Thursday, then we could go looking at the $117,000 level, an area that’s been very difficult to break above.
The size of the candlestick of course is somewhat important, although I would also be the first to say it’s not outrageously huge, so I don’t necessarily think that we have some type of panic. I think simply put; the US dollar strengthening has put a little bit of an anchor around the neck of Bitcoin during the session.
When I look at this chart, it does look like a market that is trying to break down, but I don’t see a massive breakdown at the moment. We are starting to get to an interesting area that people will have to pay close attention to. I will be waiting for the next couple of days to see which direction Bitcoin decides to move, because quite frankly we could be on the verge of something bigger.
Ready to trade daily BTC/USD forecast & predictions? We’ve made a list of the best Forex crypto brokers worth trading with.

