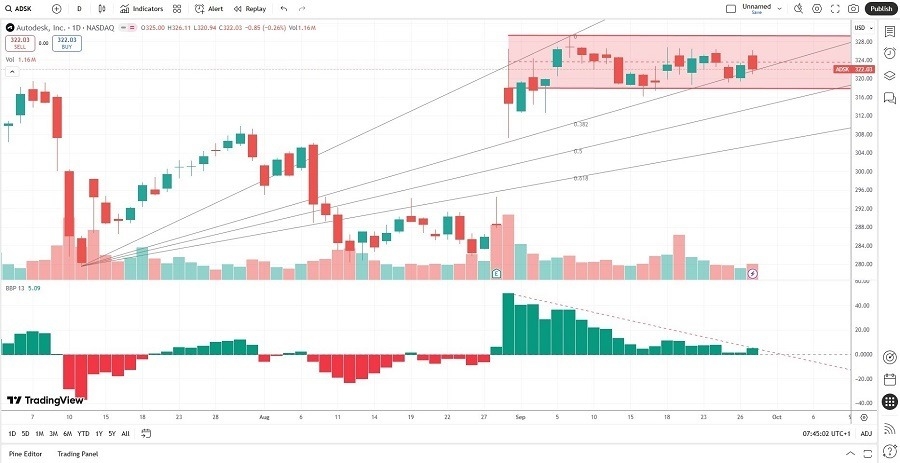
Short Trade Idea
Enter your short position between $320.94 (yesterday’s intra-day low) and $329.09 (the upper band of its horizontal resistance zone).
Market Index Analysis
- Autodesk (ADSK) is a member of the NASDAQ 100 and the S&P 500 indices.
- Both indices grind higher on the back of AI, with underlying bearish factors accumulating.
- The Bull Bear Power Indicator of the NASDAQ 100 shows a negative divergence and does not support the uptrend.
Market Sentiment Analysis
Equity markets had a lackluster start to the trading week, extending a slow grind higher on the back of NVIDIA and AI. Futures suggest a slow start, as investors grapple with the potential of a brief government shutdown that would disrupt the release of Friday’s September NFP report. Following the much-anticipated 25-basis-point interest rate cut earlier this month, a slew of economic data cast a shadow of doubt over the two interest rate cuts that a slim majority of FOMC voting members predicted.
Autodesk Fundamental Analysis
Autodesk is a multinational software company best known for AutoCAD, a computer-aided design software used by architects, engineers, and designers to design and construct models of buildings and structures.
So, why am I bearish on ADSK following its post-earnings rally?
Competition is challenging Autodesk, as confirmed by low annual recurring revenues, and operating margins are shrinking. The customer acquisition cost (CAC) payback period is lengthening, confirming higher capital requirements to attract customers. Last quarter, ADSK reported negative CAC, a red flag investors should not ignore. The annualized share price growth has also trailed its industry, and ADSK does not pay a dividend despite its maturity as a software firm.
Autodesk Fundamental Analysis Snapshot
The price-to-earnings (P/E) ratio of 67.13 makes ADSK an expensive stock. By comparison, the P/E ratio for the NASDAQ 100 Index is 32.98.
The average analyst price target for ADSK is $358.96. This suggests moderate upside potential with expanding bearish pressures.
Autodesk Technical Analysis
Today’s ADSK Signal
Autodesk Price Chart
- The ADSK D1 chart shows price action inside a horizontal resistance zone.
- It also shows price action between its ascending 0.0% and 38.2% Fibonacci Retracement Fan levels.
- The Bull Bear Power Indicator is bullish with a descending trendline, on the verge of a bearish crossover.
- The average bearish trading volumes are higher than the average bullish trading volumes.
- ADSK advanced with the NASDAQ 100, a bullish confirmation, but bearish trading signals have accumulated.
My Call on Autodesk
I am taking a short position in ADSK between $320.94 and $329.09. Economic uncertainty, high valuations, decreasing operating margins, rising competition, and one of the worst current ratios in its industry are my core reasons for taking a short position in ADSK.
- ADSK Entry Level: Between $320.94 and $329.09
- ADSK Take Profit: Between $274.26 and $281.75
- ADSK Stop Loss: Between $344.03 and $358.96
- Risk/Reward Ratio: 2.02
Ready to trade our free stock signals? Here is our list of the best stock brokers worth reviewing.


