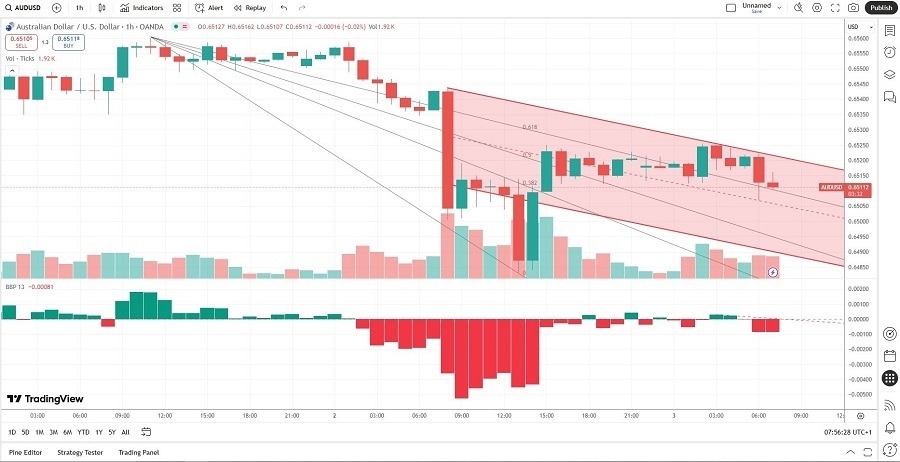
Today’s AUD/USD Signals
Short Trade Idea
- Short entry between $0.65068 and $0.65222, the previous H1 intra-day low and intra-day high, which touched the mid-level and upper band of its bearish price channel.
- Place your stop-loss level 10 pips above your entry level.
- Adjust the stop-loss to break even once the trade is 25 pips in profit.
- Take off 50% of the position as profit when the price reaches 25 pips in profit and leave the remainder of the position to run.
Long Trade Idea
- Long entry if price action breaks out above $0.65355, ten pips above the intra-day high of the last significant bullish candle inside the bearish price channel.
- Place your stop-loss level at 10 below your entry level.
- Adjust the stop-loss to break even once the trade is 25 pips in profit.
- Take off 50% of the position as profit when the price reaches 25 pips in profit and leave the remainder of the position to run.
Top Regulated Brokers
The best method to identify a classic “price action reversal” is for an hourly candle to close, such as a pin bar, a doji, an outside, or even just an engulfing candle with a higher close. You can exploit these levels or zones by watching the price action that occurs at the given levels.
AUD/USD Fundamental Analysis

Economic Data to Consider:
- The Australian manufacturing sector extended its contraction, but at a slower pace, with the AIG Manufacturing Index rising to -20.9 from -23.9 in August. The construction sector fared better, with the AIG Construction Index clocking in at 1.0 following July’s -1.3.
- Separate PMI readings on the Australian manufacturing and services sectors showed upside surprises with readings of 55.5 and 52.0 in August versus expectations of 54.9 and 51.9, respectively.
- The second-quarter GDP showed Australia beating expectations. The economy expanded 0.6% quarter-over-quarter and 1.8% year-over-year. Economists called for a rise of 0.5% and 1.6%, respectively. Adding to the strong print were upward revisions to the first-quarter GDP data.
- The US economic data will focus on July factory orders, expected to decrease 1.3% for July, following June’s plunge of 4.8%.
- Forex traders will also await JOLTS job openings data for July, where economists anticipate a decrease to 7.380 million jobs versus June’s 7.437 million.
So, why am I still bearish on the AUD/USD after upbeat economic data?
I predicted an extension of yesterday’s breakdown, and the AUD/USD delivered. I think the bearish price channel that formed after I closed my position will drive price action lower. Bearish trading volumes support more downside, and I am looking for an acceleration of the sell-off after price action moves below its descending 61.8% Fibonacci Retracement Fan level.
The Bull Bear Power Indicator has been in mostly bearish territory over the past 24 hours, with five false breakouts. The descending trendline should suffice to pressure this technical indicator lower.
Volatility could rise as bulls and bears will fight for control at a crucial junction, but I see a re-test of the 0.64832 intra-day low from the previous sell-off, from where more downside is possible. Forex traders should earn 25 to 40 pips from this short position.

AUD/USD Price Chart
Concerning the USD, there will be a release of JOLTS Job Openings data at 3pm London time. There is nothing of high importance scheduled concerning the Aussie.
Ready to trade our daily Forex signals? Here is our Forex brokers list worth checking out.
