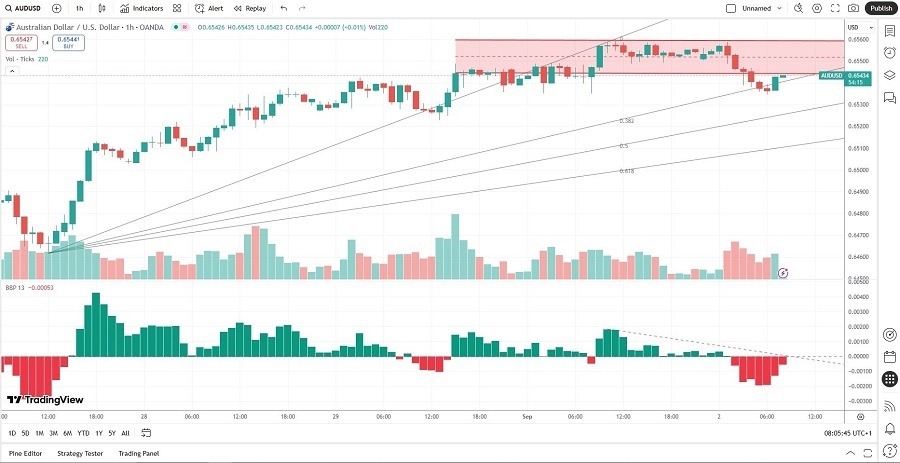
Today’s AUD/USD Signals
Short Trade Ideas
- Short entry between $0.65346 and $0.65601, the intra-day low of the breakdown and the upper band of its horizontal resistance zone.
- Place your stop loss level 10 pips above your entry level.
- Adjust the stop loss to break even once the trade is 25 pips in profit.
- Take off 50% of the position as profit when the price reaches 25 pips in profit and leave the remainder of the position to run.
Long Trade Idea
- Long entry if price action breaks out above $0.65701, ten pips above the upper band of its horizontal resistance zone, preferably following a successful re-test.
- Place your stop loss level at 10 below your entry level.
- Adjust the stop loss to break even once the trade is 25 pips in profit.
- Take off 50% of the position as profit when the price reaches 25 pips in profit and leave the remainder of the position to run.
Top Regulated Brokers
The best method to identify a classic “price action reversal” is for an hourly candle to close, such as a pin bar, a doji, an outside, or even just an engulfing candle with a higher close. You can exploit these levels or zones by watching the price action that occurs at the given levels.
AUD/USD Fundamental Analysis

Economic Data to Consider:
- Australia’s second-quarter current account deficit came in at A$13.7 billion, better than the A$15.9 billion deficit expected, and below the upward-revised first-quarter deficit of A$14.1 billion.
- The second quarter Australian net export contribution rose just 0.1%, below the expected 0.3%, but better than the 0.1% contraction reported in the first quarter.
- Economists predict today’s US August S&P Global Manufacturing PMI to show a reversal from July’s 49.8 to 53.3, suggesting an expansion.
- US July construction spending is predicted to show a contraction of 0.1%, following June’s drop of 0.4%.
- The US August ISM Manufacturing PMI is expected to improve to 49.0 with the crucial Prices Paid component rising to 65.1, following July’s readings of 48.0 and 64.8, respectively.
- Economists are upbeat about the US September IBD/TIPP Economic Optimism, expected to improve to 51.8 from August’s 50.9.
So, why am I bearish on the AUD/USD after its breakdown?
The six-hour bearish move from $0.65601, leading to a breakdown below its horizontal resistance zone, has more room to run, as bearish volumes have increased and confirmed the momentum shift.
Adding to bearish confirmation is the Bull Bear Power Indicator, which has been in bearish territory for seven hours and has been contracting for nine hours. The descending trendline could keep this technical indicator below the centerline.
I expect more downside with increased volatility. The AUD/USD could correct to its ascending 61.8% Fibonacci Retracement Fan level. US economic data may exacerbate US Dollar strength versus the Australian Dollar today. Forex traders should earn 25 to 40 pips from this short position. AUD/USD Price Chart
Ready to trade our free Forex signals? Here is our list of the best Forex brokers in the world worth checking out.
