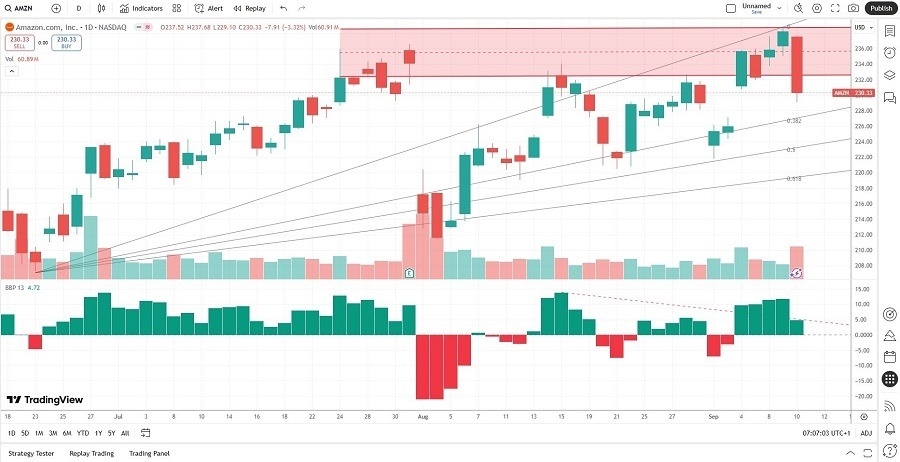
Short Trade Idea
Enter your short position between $229.10 (yesterday’s intra-day low) and $238.85 (the upper band of its horizontal resistance zone).
Market Index Analysis
- Amazon.com (AMZN) is a member of the NASDAQ 100, the Dow Jones Industrial Average, the S&P 100, and the S&P 500 indices.
- All four indices are near all-time highs with bearish breakdown patterns emerging.
- The Bull Bear Power Indicator for the NASDAQ 100 shows a negative divergence and does not confirm the uptrend.
Market Sentiment Analysis
Yesterday’s PPI report showed an unexpected contraction in producer prices for August, but investors will focus on today’s CPI release. Equity markets brushed off the better-than-expected reading yesterday, but Oracle stole the show and kept the AI hype alive with a blockbuster earnings report and future guidance. Today’s CPI report could determine how steeply the US Fed will slash interest rates.
Amazon.com Fundamental Analysis
Amazon.com is one of the Big Five US technology companies and a leader in the global AI race and cloud computing sector. It has excellent profit margins, but its debt remains excessive. AMZN is an industry disruptor but faces stiff competition from China.
So, why am I bearish on AMZN after its momentum shift?
Amazon has launched its Zoox robo-taxi, but it must invest more capital in the sector to become competitive. I like the long-term potential of Amazon, but I also see more downside in the medium term, driven by a capital-intensive business plan that has yet to deliver for investors. AI, cloud computing, and retail competition from China diminish its global sales outlook outside core US allies, and Jeff Bezos continues to offload shares.
Amazon.com Fundamental Analysis Snapshot
The price-to-earning (P/E) ratio of 35.11 makes AMZN an expensive stock. By comparison, the P/E ratio for the NASDAQ 100 is 30.22.
The average analyst price target for AMZN is $263.18. This suggests good upside potential, but medium-term downside risks remain.
Amazon.com Technical Analysis
Today’s AMZN Signal
Amazon.com Price Chart
- The AMZN D1 chart shows price action breaking down below its horizontal resistance zone.
- It also shows price action between its ascending 0.0% and 38.2% Fibonacci Retracement Fan levels.
- The Bull Bear Power Indicator is bullish with a descending trendline.
- The bearish trading volume during the breakdown more than doubled, confirming the breakdown.
- AMZN corrected with the NASDAQ 100, a bearish confirmation.
My Call on Amazon.com
Top Regulated Brokers
I am taking a short position in AMZN between $229.10 and $238.85. AMZN has long-term upside potential, but I am bearish in the medium-term. Competition from China, Bezos’ share sales, and future capital requirements combine for more downside potential.
- AMZN Entry Level: Between $229.10 and $238.85
- AMZN Take Profit: Between $197.85 and $207.31
- AMZN Stop Loss: Between $242.52 and $247.37
- Risk/Reward Ratio: 2.33
Ready to trade our free daily signals? Here is our list of the best brokers for trading worth reviewing.


