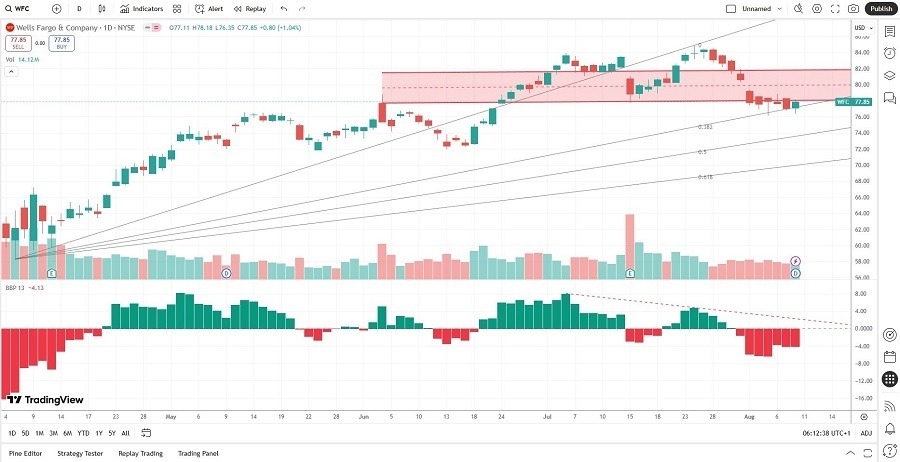
Short Trade Idea
Enter your short position between 76.16 (the intra-day low of the current sell-off) and 79.91 (the mid-range of its horizontal resistance zone).
Market Index Analysis
- Wells Fargo (WFC) is a member of the S&P 100 and the S&P 500
- Both indices trade near record highs, but bearish developments build up underneath
- The Bull Bear Power Indicator of the S&P 500 shows a negative divergence
Market Sentiment Analysis
Equity markets pushed higher last week amid optimism for a 50-basis-point interest rate cut by the end of the year, supported by the ongoing hype surrounding AI. Inflation will come into focus with this week’s CPI and PPI reports, as investors await the impact of tariffs, but it may be too early to be reflected. Debt market jitters intensify, but equity investors ignore them for now. The underlying economic slowdown that may prompt an interest rate cut is a double-edged sword that could force a correction, but today’s sentiment remains bullish.
Wells Fargo Fundamental Analysis
Wells Fargo is a banking conglomerate serving over 70 million customers in more than 35 countries. It is one of the Big Four Banks in the US and remains classified as a systemically important financial institution by the Financial Stability Board.
So, why am I bearish on WFC after its breakdown?
The declining dividend yields and the high debt-to-equity ratio are two significant red flags. I am most worried about its latest three-year revenue forecast of 4.9% annualized. Compare this to the 7.7% the US banking industry. I appreciate the company-wide implementation of AI as agents in collaboration with Google Cloud, but the threat of interest rate cuts will further diminish its revenue potential.
Wells Fargo Fundamental Analysis Snapshot

The price-to-earnings (P/E) ratio of 13.38 makes WFC an expensive stock. By comparison, the P/E ratio for the S&P 500 is 29.49.
The average analyst price target for WFC is 86.96. While it represents decent upside potential, the current interest rate environment could prevent WFC from reaching it.
Wells Fargo Technical Analysis
Today’s WFC Signal

- The WFC D1 chart shows price action just below its horizontal resistance zone
- It also shows price action challenging its ascending 38.2% Fibonacci Retracement Fan level
- The Bull Bear Power Indicator turned bearish with a descending trendline
- Bearish trading volumes are stable during the most recent correction, suggesting ongoing selling pressure.
- WFC corrected with the S&P 500 advancing, a significant bearish signal
My Call
I am taking a short position in WFC between 76.16 and 79.91. The revenue forecast was a big disappointment in its latest earnings release, and the prospect of lower interest rates in a stagnant economy should push price action lower.
- WFC Entry Level: Between 76.16 and 79.91
- WFC Take Profit: Between 58.42 and 63.40
- WFC Stop Loss: Between 82.59 and 84.83
- Risk/Reward Ratio: 2.76
Ready to trade our free daily signals? Here is our list of the best brokers for trading worth checking out.
