Fundamental Analysis & Market Sentiment
I wrote on 27th July that the best trades for the week would be:
- Long of the NASDAQ 100 Index. This fell over the week by 2.77%.
- Long of the S&P 500 Index. This fell over the week by 2.83%.
- Long of Bitcoin following a daily close above $120,055. This did not set up.
- Long of Ethereum following a daily close above $4,000. This did not set up.
- Long of HG Copper futures following a daily close above $5.9585 or $6 for more conservative traders. This did not set up.
- Long of Silver following a daily close $39.30 or $40 for more cautious traders. This did not set up.
- Long of Platinum in USD terms following a daily close above $1,500. This did not set up.
The small overall loss of 5.60% equals a loss of 0.80% per asset.
The news last week was dominated by the US Federal Reserve’s policy meeting, which produced a hawkish tilt. Although the Federal Funds Rate was maintained at 4.50% as was almost universally expected, comments and forecasts made by Jerome Powell and the FOMC sharply reduced expectations of a 0.25% rate cut at the next meeting in September. Stronger than expected Advance GDP data helped fuel this more hawkish narrative, but Friday’s weaker than expected jobs data when Non-Farm Payrolls were released completely reversed the situation and led to stock markets and other risky assets falling sharply. According to the CME’s FedWatch tool, the chance of a 0.25% rate cut in September now stands as high as 80%.
The central bank policy meetings in Japan and Canada were of little consequence.
There was more volatility than has been usual over recent weeks. The Forex market saw it especially in the Japanese Yen and in the Antipodean currencies (AUD, NZD).
Fears of a faltering US economy and a Fed that may have kept interest rates too high for too long will likely translate into risk-off sentiment as this week opens later.
A summary of last week’s most important data:
- US Federal Funds Rate and FOMC Statement – the Federal Funds rate was unchanged, but the Fed talked down the prospect of an imminent rate cut at its next meeting.
- US Core PCE Price Index – as expected.
- US Average Hourly Earnings– as expected.
- US Advance GDP – much stronger than expected, showing a 3.0% annualized increase.
- US Non-Farm Employment Change – weaker than expected.
- US JOLTS Job Openings – approximately as expected.
- Bank of Japan Policy Rate, Monetary Policy Statement, and Outlook Report – no surprises.
- Bank of Canada Overnight Rate, Monetary Policy Report, and Rate Statement – no surprises.
- Australian CPI (inflation) – lower than expected, at 1.9% annualized.
- Canada GDP – as expected.
- US Unemployment Rate – as expected.
- US ISM Manufacturing PMI – slightly worse than expected.
- US Employment Cost Index– a fraction better than expected.
- US Unemployment Claims – as expected.
- China Manufacturing PMI – very slightly worse than expected.
Top Regulated Brokers
The Week Ahead: 4th – 8th August
The coming week has a much lighter program of high impact data releases, including only one major central bank policy meeting, so we are likely to see a quieter market over the coming week, especially in Forex.
This week’s important data points, in order of likely importance, are:
- Bank of England Policy Meeting
- US ISM Services PMI
- Swiss CPI (inflation)
- Canada Unemployment Rate
- New Zealand Unemployment Rate
Monthly Forecast August 2025

For the month of August 2025, I forecasted that the EUR/USD currency pair will rise in value.
I abandon my forecast now at a profit, as the long-term bullish trend in the EUR/USD has ended

Weekly Forecast 4th August 2025
I made no weekly forecast last week.
There were no unusually large price movements in currency crosses last week, so I again make no weekly forecast this week.
The US Dollar was the strongest major currency last week, while the New Zealand Dollar was the weakest, although the overall directional movement was quite small. Volatility increased last week, with 37% of the most important Forex currency pairs and crosses changing in value by more than 1%. Next week’s volatility is likely to decrease due to a lighter data agenda and the widespread August holiday slowdown.
You can trade these forecasts in a real or demo Forex brokerage account.
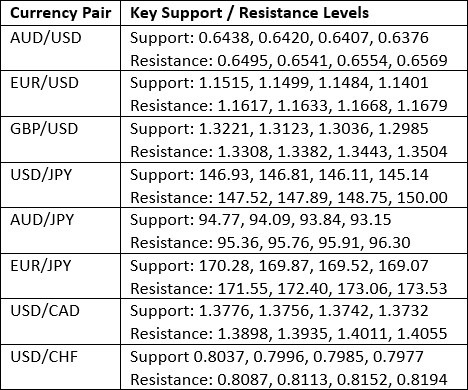
Key Support/Resistance Levels for Popular Pairs
Technical Analysis
US Dollar Index
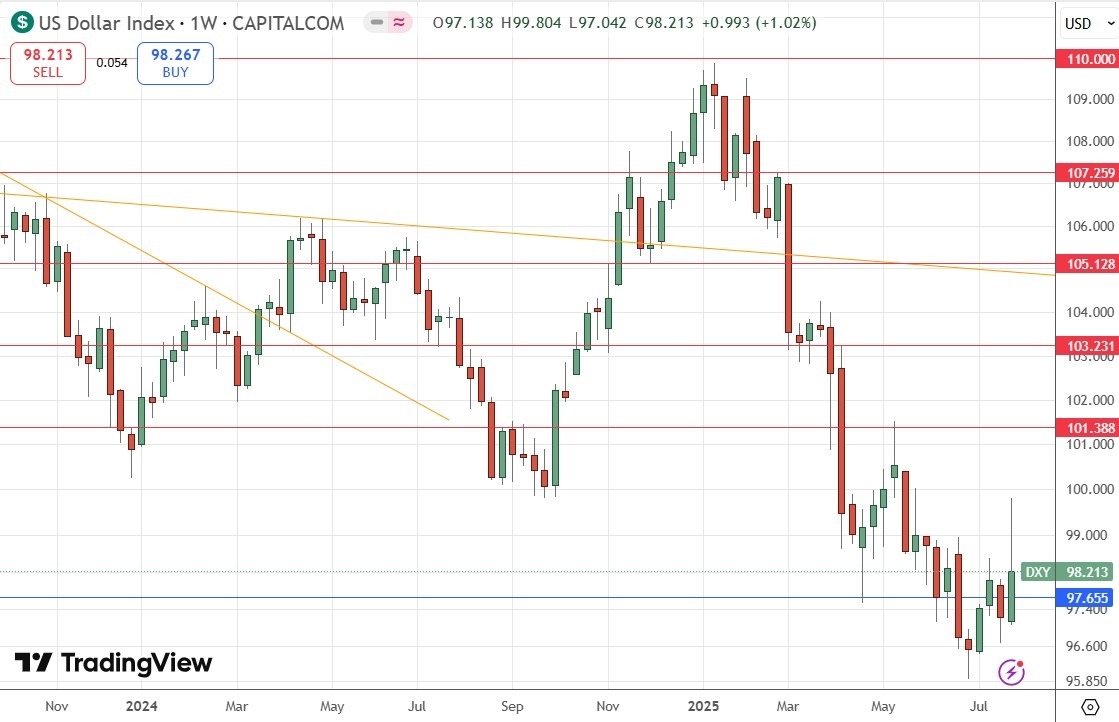
Last week, the US Dollar Index printed a large bullish candlestick which made a deep bullish retracement against the long-term bearish trend, but there was a notably large upper wick which reflected Friday’s sharp turnaround against the US Dollar strength.
The greenback had strengthened after Fed Chair Powell talked tough against waiting for tariff inflation, which reduced expectations of a September rate cut, sending the Dollar surging higher. However, Friday’s weaker than expected jobs data spooked the market, with President Trump fuming that the data was “fake”. In any case, the numbers sent the Dollar plummeting.
I think it is wise to trade with the long-term trend while expecting volatility and pullbacks within this trend. However, there is quite a lot of residual strength in the Dollar, so I would not want to rely on Dollar weakness to create a good trade over the coming week.
NASDAQ 100 Index
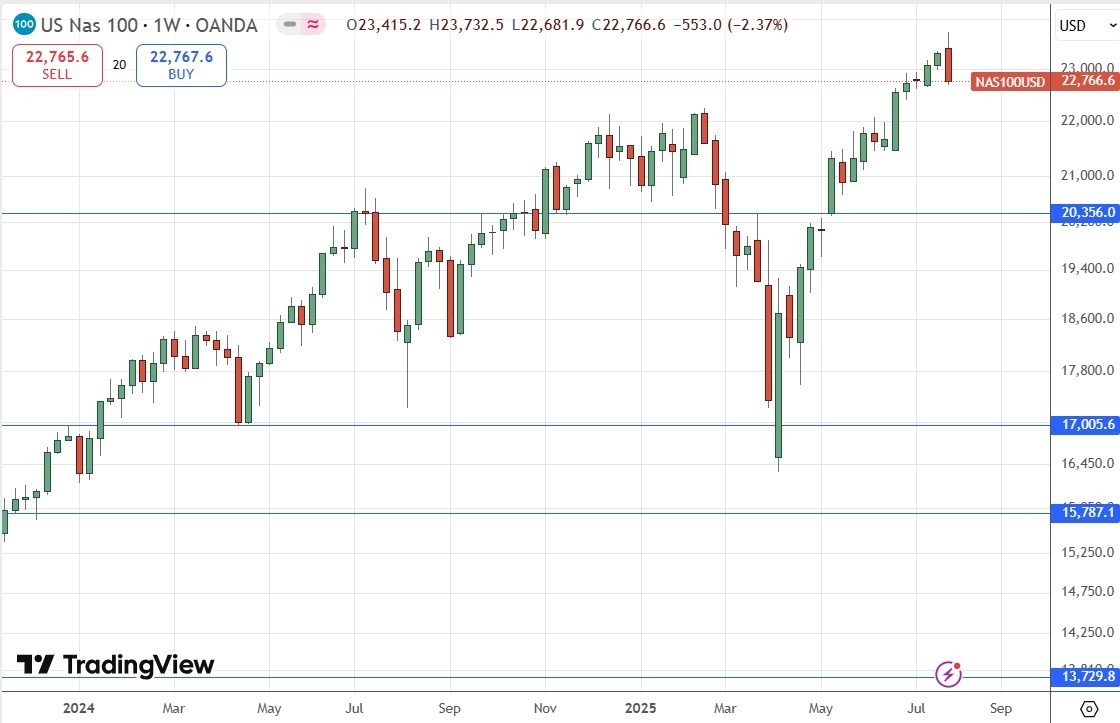
The NASDAQ 100 Index fell sharply on the final two days of last week, printing a bearish engulfing candlestick and closing right at its weekly low.
In the early part of the week, the Index kept rising to make new record highs, but Thursday and Friday saw sharp falls after Fed Chair Jerome Powell indicated rates would remain elevated for longer due to fears over tariff-generated inflation. This produced strong falls over two consecutive days. There is bearish momentum.
Despite this drop, note that the price is still only about 2X the long-term average true range. Significantly lower daily closes would start to shake out a lot of trend traders who have been long of this Index for at least the past few weeks.
I will hold on to my long trade for the time being, but I will be wary of entering any new long breakout positions unless volatility starts to drop again.
S&P 500 Index
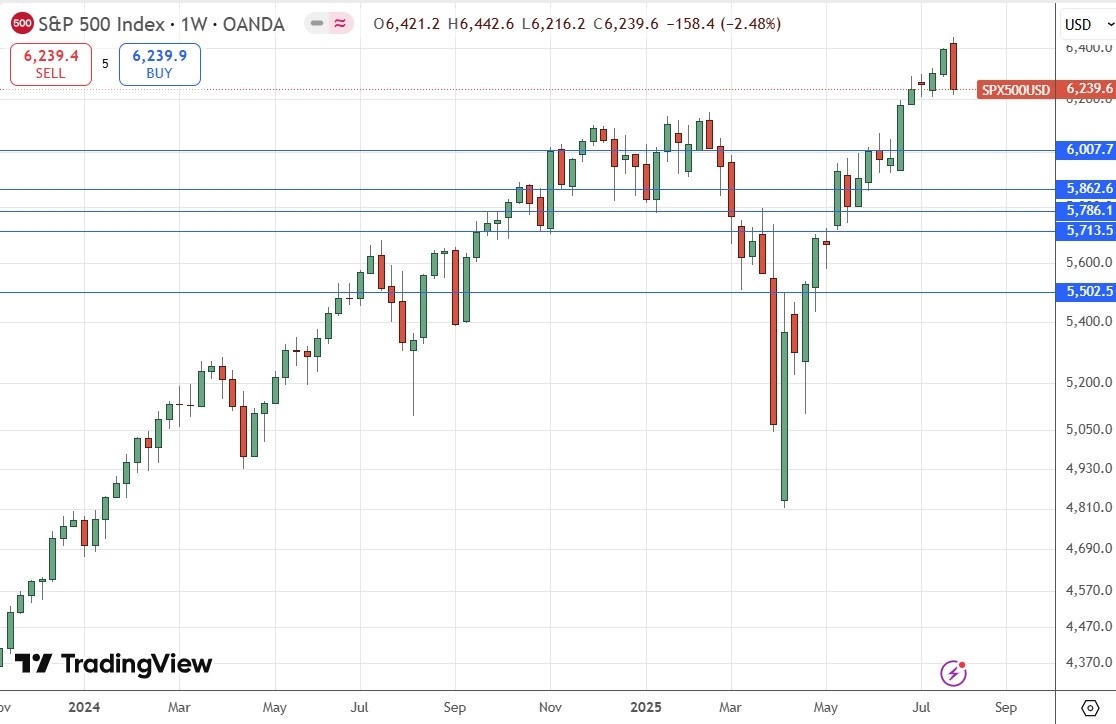
The S&P 500 Index performed very similarly to the NASDAQ 100 Index last week. Everything I wrote above about that tech index also applies here to the S&P 500 Index, with the exception that the S&P 500’s recent price action looks marginally more bullish than that of the NASDAQ 100 Index, only because it did not close right on the low of the week’s price range.
BTC/USD
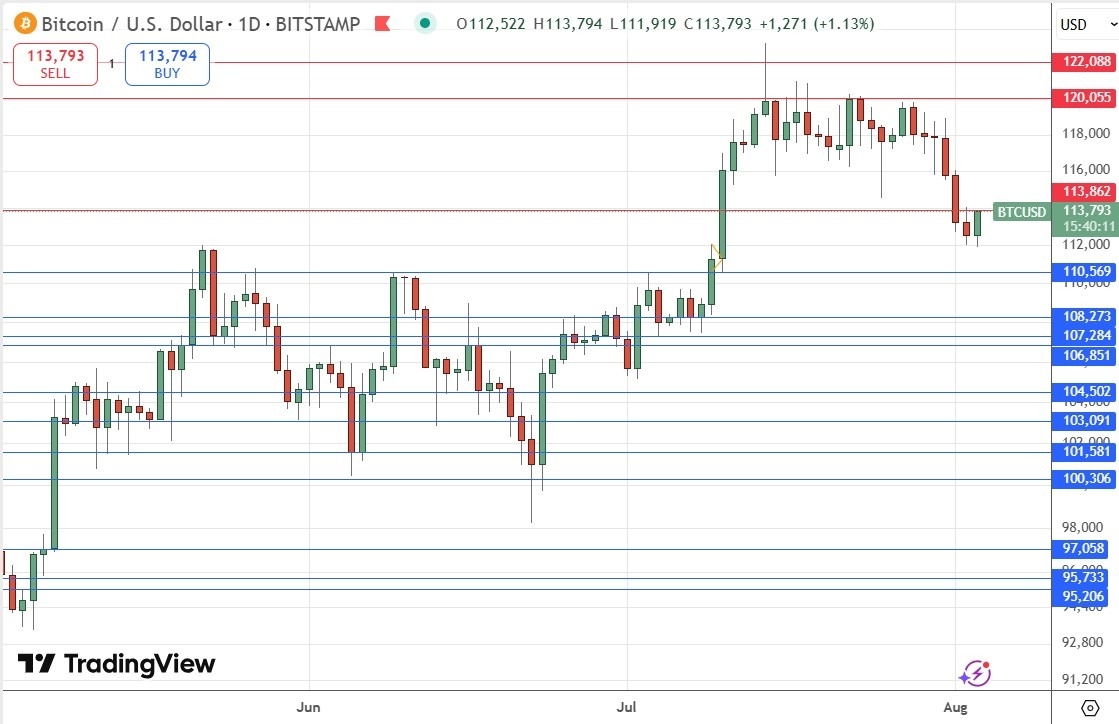
Bitcoin in US Dollar terms saw a strong fall last week, breaking below the $117,000 floor which it had respected for many days. The price almost got low enough to shake out the many trend traders who will be long of this cryptocurrency, but it seems to be holding up above $112,000.
This was a significant breakdown, but we are starting to see a recovery. Although there is a key resistance level just overhead, I think the level to watch closely with be $115,000. If the price can hold up above that major round number, it has a shot at testing the very strong resistance level at $120,055 again.
I see a new record high New York close above $120,055 as a suitable trigger for entering a new long trade.
XAU/USD
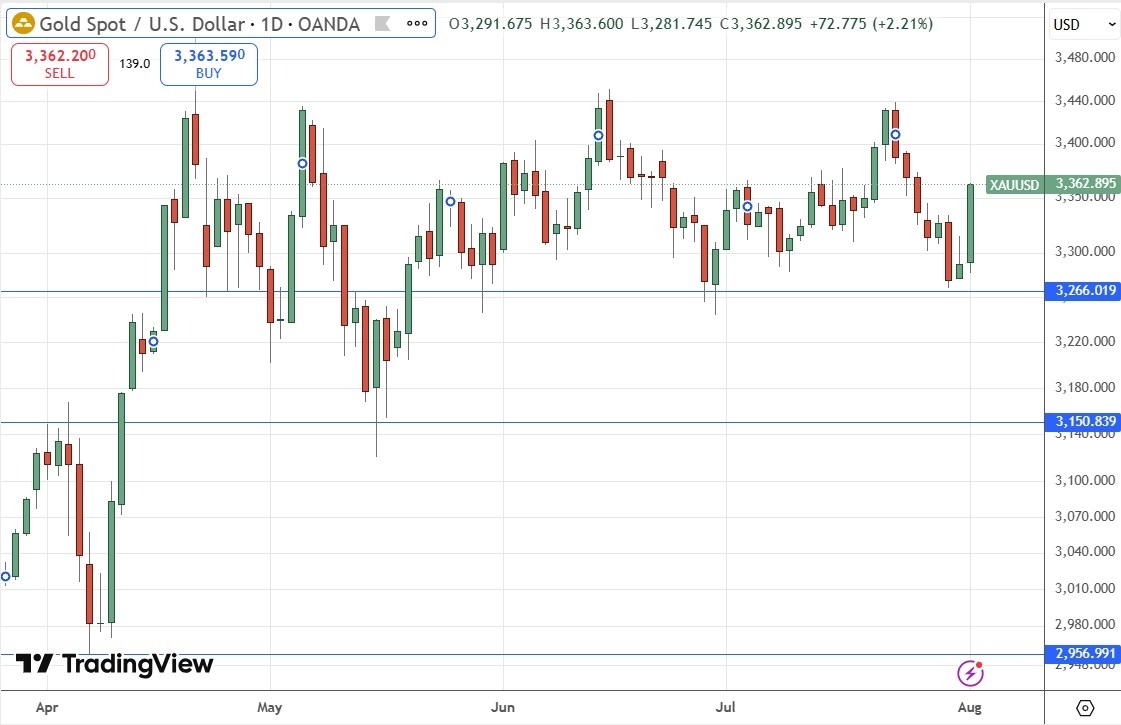
Many precious metals including Gold were behaving quite bullishly over recent weeks, although while others had been breaking to new highs, Gold was consolidating.
All precious metals sold off earlier last week and Gold was no exception, but the price chart below shows that recent lows held, and Friday was a day of strong gains. The price is now only about $70 off its record high daily close.
With stock markets starting to turn notably sour, although it is early days, we may be seeing the start of a flight to safety, with both Gold and the Japanese Yen making major gains at the end of last week. So, if we get another record high daily close, entering a new long trade as a trend trade would make sense.
More conservative traders might want to wait and see the record high at $3,500 taken out first before entering any new trade.
Bottom Line
I see the best trades this week as:
- Long of Bitcoin following a daily close above $120,055.
- Long of Gold following a daily close above $3,433 or $3,500 for more cautious traders.
Ready to trade our Forex weekly forecast? Check out our list of the top 5 Forex brokers in the world.
