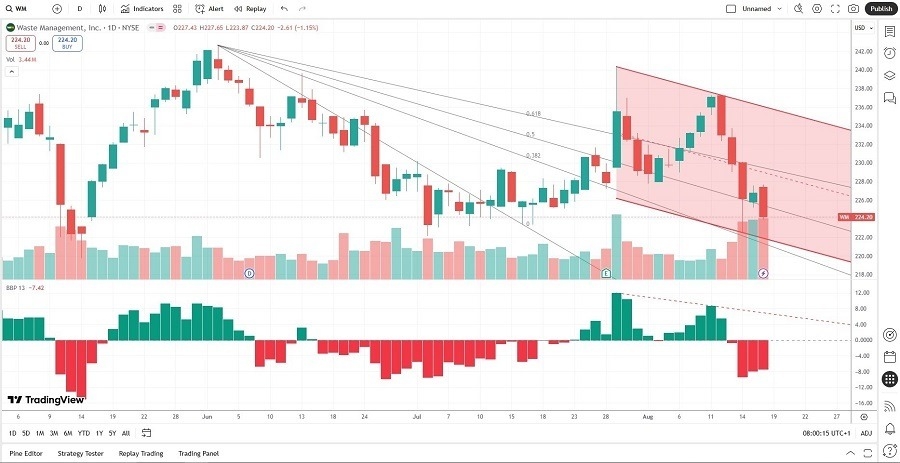
Short Trade Idea
Enter your short position between 222.46 (the last time price action touched the lower band of its bearish price channel) and 227.65 (yesterday’s intra-day high).
Market Index Analysis
- Waste Management (WM) is a member of the S&P 500
- This index hovers near records, but bearish conditions accumulate
- The Bull Bear Power Indicator of the S&P 500 shows a negative divergence
Market Sentiment Analysis
Equity markets took a breather to start the week. High-stakes talks between US President Trump and his Ukrainian counterpart failed to reassure investors about near-term changes. The release of minutes from the Federal Reserve on Wednesday, along with the Jackson Hole Economic Symposium, is a potential market mover. A light week on the economic front, with retail earnings on the horizon, may inject market volatility with their outlooks. Bank of America released a research note arguing for the end of mega-cap dominance, comparing the run to the pre-dot-com crash.
Top Regulated Brokers
Waste Management Fundamental Analysis
Waste Management is a comprehensive waste and environmental services company. It has 337 transfer stations, 254 active landfill disposal sites, 97 recycling plants, 135 beneficial-use landfill gas projects, six independent power production plants, and 26,000 collection and transfer vehicles.
So, why am I bearish on WM after its earnings beat?
Waste Management ranks among the favorite stocks among institutional investors, but the recent insider selling raises concerns, as more could follow. The high valuations do not justify the current share price, and the balance sheet issues are notable. I am also worried about the drop in free cash flow.
Waste Management Fundamental Analysis Snapshot

The price-to-earnings (P/E) ratio of 21.56 makes WM an expensive stock for its sector. By comparison, the P/E ratio for the S&P 500 is 29.77.
The average analyst price target for WM is 256.45. It suggests moderate upside potential, but downside risks are rising.
Waste Management Technical Analysis
Today’s WM Signal

- The WM D1 chart shows price action inside a bearish price channel
- It also shows price action breaking down below its 61.8% and 50.0% Fibonacci Retracement Fan levels
- The Bull Bear Power Indicator is bearish with a descending trendline
- The average bearish trading volumes are notably higher than the average bullish trading volumes
- WM corrected as the S&P 500 moved higher, a significant bearish trading signal
My Call
I am taking a short position in WM between 222.46 and 227.65. Insider selling could accelerate as institutions rotate out of underperforming stocks. I am concerned about the contraction in free cash flow. Additionally, the balance sheet does not justify current valuations.
- WM Entry Level: Between 222.46 and 227.65
- WM Take Profit: Between 199.69 and 204.55
- WM Stop Loss: Between 232.70 and 237.23
- Risk/Reward Ratio: 2.22
Ready to trade our free daily signals? Here is our list of the best brokers for trading worth checking out.
