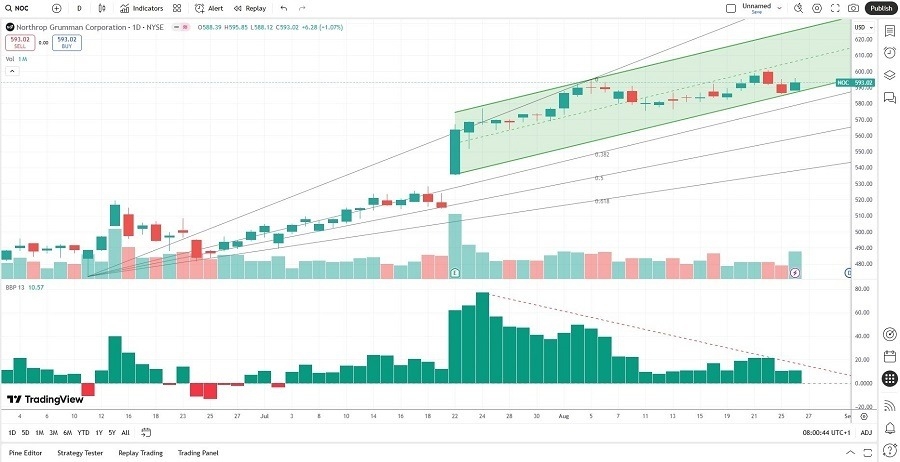
Long Trade Idea
Enter your long position between 586.05 (the intra-day low of its last bearish candlestick) and 595.85 (yesterday’s intra-day high).
Market Index Analysis
- Northrop Grumman (NOC) is a member of the S&P 500 Index.
- This index hovers near record highs, but bearish conditions continue to accumulate.
- The Bull Bear Power Indicator of the S&P 500 shows a negative divergence.
Market Sentiment Analysis
Equity markets brushed off President Trump’s bid to remove Fed Governor Cook and dismissed his renewed tariff threats as another episode of the TACO (Trump always chickens out) trade. Following yesterday’s positive session, futures suggest more upside amid hopes for NVIDIA earnings due after the bell to confirm the AI trade remains intact. Concerns over an AI bubble began to surface this month, but hopes for an interest rate cut next month have limited the downside. New tariffs on India kicked in today, but investors eagerly await Friday’s US inflation data.
Northrop Grumman Fundamental Analysis
Northrop Grumman is an aerospace and defense company. NOC is the 5th largest US government contractor and receives over 2% of federal government spending on contractors.
So, why am I bullish on NOC after its massive rally?
The order book is rock solid, and valuations remain highly attractive. The recent idea that the Pentagon might take equity stakes in defense companies in a deal similar to the Intel deal could provide a capital injection to bolster its research and development into future weapons platforms and into its space division. Defense spending by NATO members will provide stable, future revenues, and Northrop Grumman is a buy-the-dip candidate for the rest of this decade.

Northrop Grumman Fundamental Analysis Snapshot
The price-to-earnings (P/E) ratio of 21.88 makes NOC an inexpensive stock. By comparison, the P/E ratio for the S&P 500 is 29.72.
The average analyst price target for NOC is 598.04. It suggests limited upside potential, but I expect another surge in price action, followed by price target upgrades.
Northrop Grumman Technical Analysis
Today’s NOC Signal

Northrop Grumman Price Chart
- The NOC D1 chart shows price action inside a bullish price channel.
- It also shows price action between its ascending 0.0% and 38.2% Fibonacci Retracement Fan levels.
- The Bull Bear Power Indicator has been bullish since July.
- The average bullish trading volumes are higher than the average bearish trading volumes.
- NOC rallied with the S&P 500, a significant bullish trading signal.
My Call on Northrop Grumman
I am taking a long position in NOC between 586.05 and 595.85. The low valuations make NOC an attractive buy, while the idea of a government stake has increased bullish sentiment. Ongoing defense spending by NATO will provide stable revenue growth for the next ten years, making NOC an excellent long-term buy.
- NOC Entry Level: Between 586.05 and 595.85
- NOC Take Profit: Between 673.11 and 706.77
- NOC Stop Loss: Between 551.80 and 563.64
- Risk/Reward Ratio: 2.54
Ready to trade our daily Forex analysis? We’ve made this forex brokers list for you to check out.
