Short Trade Idea
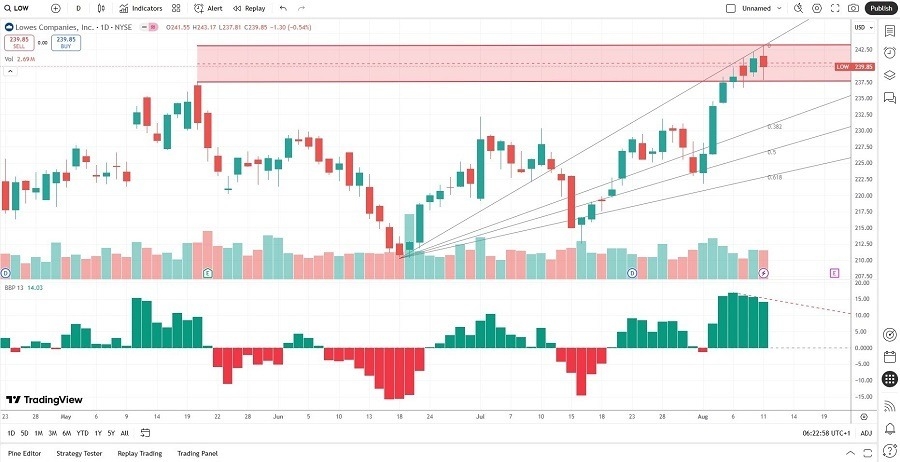
Enter your short position between 237.81 (yesterday’s intra-day low) and 243.17 (yesterday’s intra-day high).
Market Index Analysis
- Lowe’s (LOW) is a member of the S&P 100 and the S&P 500
- Both indices remain near record highs, but bearish pressure continues to rise
- The Bull Bear Power Indicator of the S&P 500 shows a negative divergence
Market Sentiment Analysis
Equity markets closed marginally lower yesterday, with today’s CPI report for July in focus. Economists expect an increase in consumer inflation, and a higher-than-expected number could drive stocks lower. US President Trump agreed to delay the harshest Chinese tariffs for another 90 days to allow for negotiations to continue, keeping the TACO (Trump always chickens out) trade alive. Legal experts question the legality of the deal Trump struck with NVIDIA and AMD. Both companies agreed to pay 15% of their revenues from China chip sales to the government.
Lowe’s Fundamental Analysis
Lowe’s is a home improvement retailer with over 1,750 stores across the US. It is the second-largest hardware store globally, trailing its rival Home Depot.
So, why am I bearish on LOW despite its massive rally?
The most concerning development is the contraction in same-store sales. Over the past two years, LOW reported an average annualized contraction of 3.4%. Gross margins of 33.33% over the same period show an unsustainable business model compared to the share price. Lowe’s is also closing stores, and its current ratio flashes a massive bearish red flag.
Lowe’s Fundamental Analysis Snapshot

The price-to-earnings (P/E) ratio of 19.95 makes LOW an expensive stock for a retailer. By comparison, the P/E ratio for the S&P 500 is 29.49.
The average analyst price target for LOW is 263.94. It represents decent upside potential, but the downside risks are rising at a faster clip.
Lowe’s Technical Analysis
Today’s LOW Signal

- The LOW D1 chart shows price action inside a massive horizontal resistance zone
- It also shows price action climbing a wall of worry at its ascending 0.0% Fibonacci Retracement Fan level
- The Bull Bear Power Indicator is bullish with a descending trendline
- Bearish trading volumes rose during yesterday’s trading session at critical resistance levels
- LOW followed the S&P 500 higher, but faces mounting bearish pressures
My Call
I am taking a short position in LOW between 237.81 and 243.17. A slowing economy, higher input costs due to tariffs, same-store sales contractions, and ongoing store closures do not justify the current share price. I advise caution and will sell the current rally in LOW.
- LOW Entry Level: Between 237.81 and 243.17
- LOW Take Profit: Between 210.41 and 214.91
- LOW Stop Loss: Between 248.64 and 252.95
- Risk/Reward Ratio: 2.53
Ready to trade our free daily signals? Here is our list of the best brokers for trading worth checking out.
