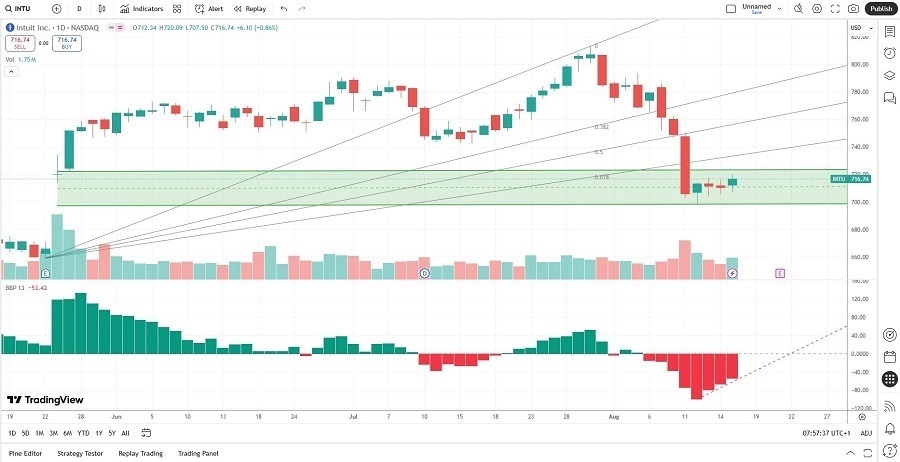
Long Trade Idea
Enter your long position between 699.06 (the lower band of its horizontal support zone) and 722.45 (the upper band of its horizontal support zone).
Market Index Analysis
- Intuit (INTU) is a member of the NASDAQ 100, the S&P 100, and the S&P 500
- All three indices are near record highs, but average bearish trading volumes are higher than average bullish trading volumes since the first week of July
- The Bull Bear Power Indicator of the NASDAQ 100 is bullish, but shows a negative divergence
Market Sentiment Analysis
Equity markets will focus on this week’s Jackson Hole Economic Symposium and the speech by Federal Reserve Chair Jerome Powell. July’s PPI index has raised concerns among many economists, especially as markets price in an 85% chance of a 25-basis-point interest rate cut by the US central bank in September. The conditions for stagflation raise alarms, which could pressure equity markets into a much-anticipated correction. Consumer confidence and inflation expectations suggest more trouble ahead.
Intuit Fundamental Analysis
Intuit is a business software company best known for its small business accounting software, QuickBooks. Other leading services include tax preparation application TurboTax, its e-mail marketing platform Mailchimp, and its credit monitoring service Credit Karma.
So, why am I bullish on INTU despite its correction?
The implementation of generative AI into the Intuit business model and software is among the best in its sector. The AI-powered Payments Agent in QuickBooks has won multiple recognitions, including the best integration with human expertise. The return on invested capital ranks among the best in its industry, and the PEG ratio suggests excellent growth potential moving ahead, while double-digit earnings per share growth is encouraging.
Intuit Fundamental Analysis Snapshot

The price-to-earnings (P/E) ratio of 58.51 makes INTU an expensive stock. By comparison, the P/E ratio for the NASDAQ 100 is 42.20.
The average analyst price target for INTU is 825.19. It suggests excellent upside potential from current levels, but short-term risks remain.
Intuit Technical Analysis
Today’s INTU Signal

- The INTU D1 chart shows price action inside a horizontal support zone
- It also shows a breakdown below the ascending 61.8% Fibonacci Retracement Fan level
- The Bull Bear Power Indicator is bearish, but is approaching a potential bullish crossover with an ascending trendline
- The average bullish trading volumes have been higher than the average bearish trading volumes since price action reached support
- INTU corrected as the NASDAQ 100 moved higher, a significant bearish trading signal, but bullish conditions have accumulated
My Call
I am taking a long position in INTU between 699.06 and 722.45. INTU ranks among the leading financial software companies with successful AI integration and human expertise. It creates a stable platform for revenue growth, but I expect a bumpy road ahead in the short term.
Top Regulated Brokers
- INTU Entry Level: Between 699.06 and 722.45
- INTU Take Profit: Between 807.93 and 825.19
- INTU Stop Loss: Between 659.00 and 672.81
- Risk/Reward Ratio: 2.72
Ready to trade our free daily signals? Here is our list of the best brokers for trading worth checking out.
