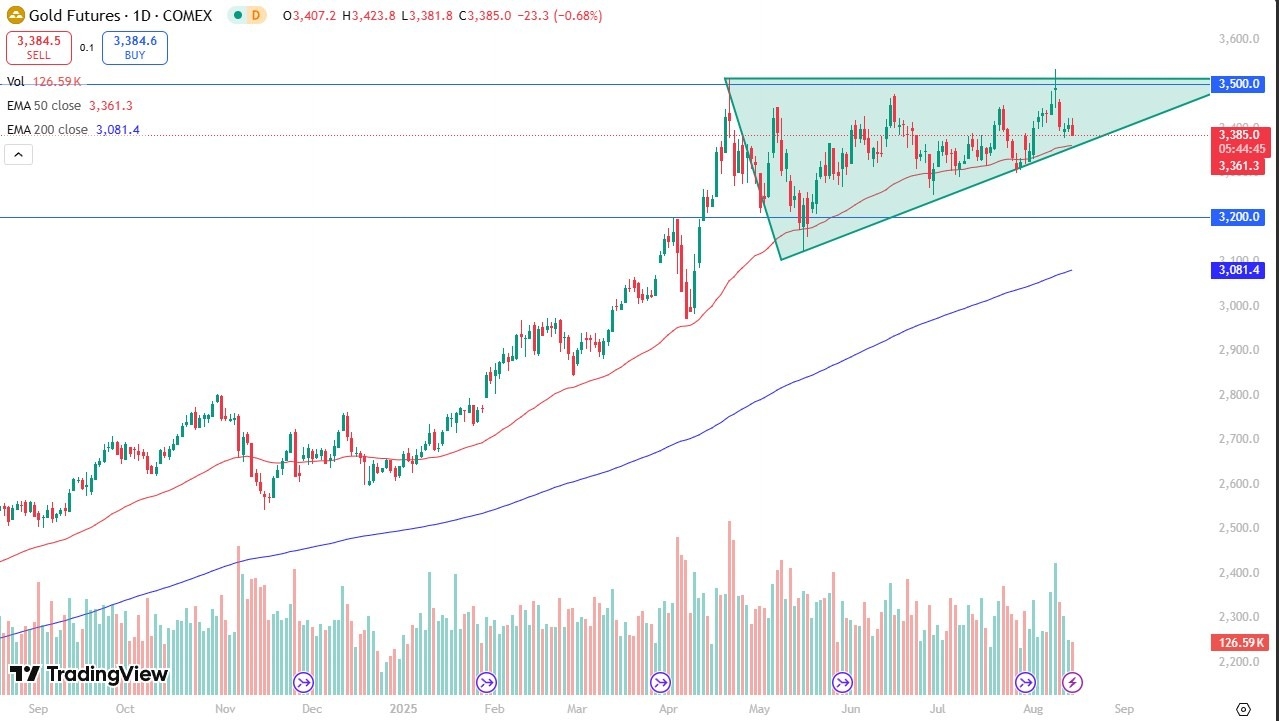
- During the trading session on Thursday, we saw the gold market initially tried to rally but then rolled over again.
- All things being equal, this is a market that seems to be trying to find some type of floor, and after the much hotter than anticipated PPI numbers coming out the United States, we have seen the US dollar and the bond market both cause quite a bit of volatility.
- Gold was one of the victims of this movement, as both interest rates in the US dollar have a major influence on how the gold market behaves.

Technical Analysis
Top Regulated Brokers
The technical analysis for this market is very noisy, as we had initially tried to rally during the trading session, but it looks like we are getting ready to drop to the 50 Day EMA, the indicator that has been acting like a bit of a significant uptrend line. All things being equal, this is a market that has been bullish over the longer term, but the last couple of months have been somewhat sideways, so therefore we should be looking at this through the prism of a market that has been working off some of the excess froth from previous strength.
That being said, if the market were to rally from here then we will start to look at the possibility of the $3500 level as a major resistance barrier, especially as we had formed such a nasty candlestick last Friday. If we can break above there, then it’s likely that we could go to the $3800 level based on the measured move of the potential “ascending triangle” that I have drawn on the chart. Even if we break down below the 50 Day EMA, I think there is a massive amount of support near the $3200 level, which has been major support multiple times along the way, and previously had been significant resistance. All things being equal, this is a market that should continue to go higher over the longer term.
Ready to trade our Gold price forecast? We’ve made a list of the best Gold trading platforms worth trading with.
