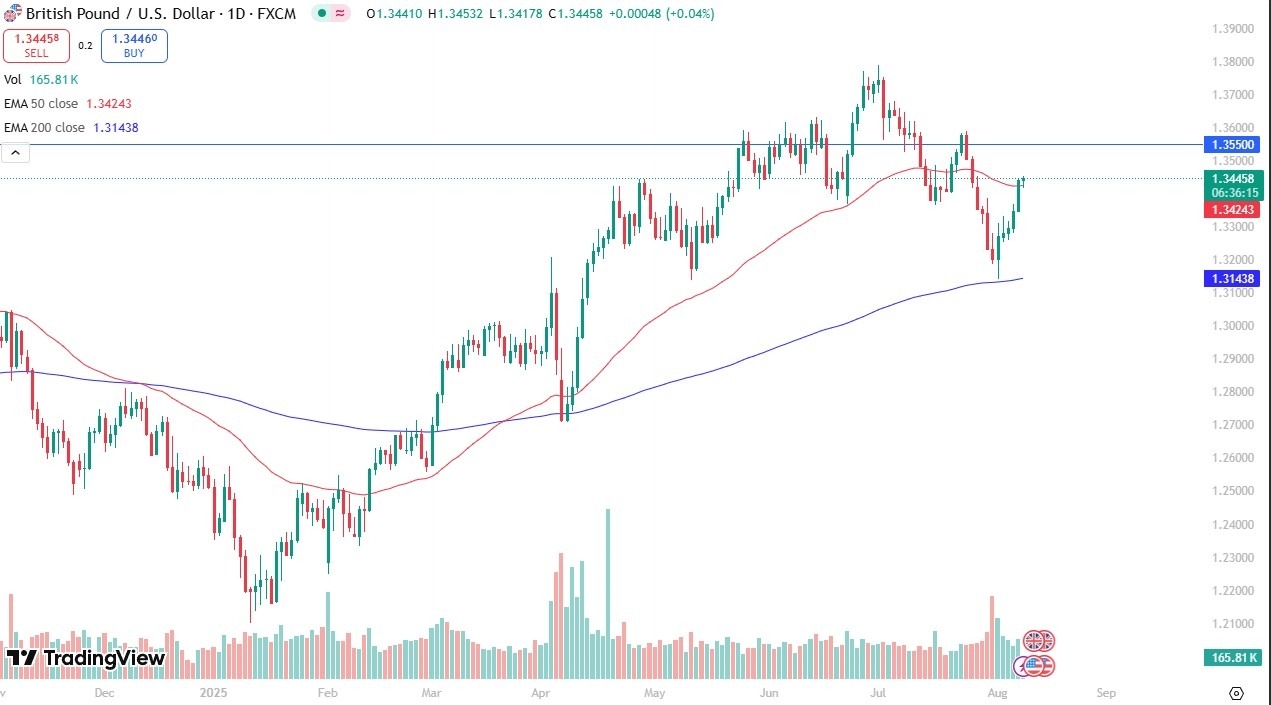
- The British pound has been slightly positive during the trading session on Friday, after we initially fell toward the 50 Day EMA.
- The 50 Day EMA is an indicator that a lot of people are watching most of the time, as we continue to see it act as dynamic support and resistance.
- It is probably worth noting that we have turned around to show signs of bullish behavior, and if we can break above the current area, we could go as high as 1.3550, an area that’s been important multiple times.
It is also worth noting that 5 or 6 candles ago on the daily chart, we had tested the 200 Day EMA, only to turn around and bounce rather significantly. With that being the case, the market is likely to continue to see quite a bit of buying on the dips, but the question at this point now is going to be whether or not we can find any momentum? After all, we need momentum to finally break out to the upside again, after that initial drop over the last couple of weeks.
Technical Analysis
Top Forex Brokers
Now that we are just above the 50 Day EMA, it does suggest that the market could go looking to the 1.3550 level, an area that has been important more than once. With that being the case, I think you’ve got a situation where if we can break above there, then the buyers will probably jump into the market with quite a bit more gusto. On the other hand, if we break down below the 1.33 level, then it could open up the possibility of a move down to the 200 Day EMA, currently residing at the 1.3143 level. Anything below there would obviously be very negative, but I think what it is worth noting is that we have recently made a “lower low”, so now the question is will we make a “lower high?”
Ready to trade our GBP/USD daily forecast? We’ve shortlisted the best regulated forex brokers UK in the industry for you.

