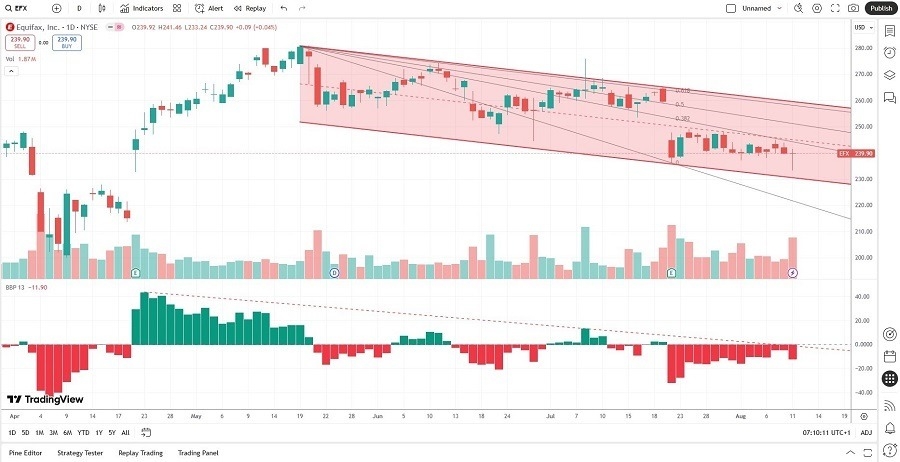
Short Trade Idea
Enter your short position between 233.24 (yesterday’s intra-day low) and 241.46 (yesterday’s intra-day high).
Market Index Analysis
- Equifax (EFX) is a member of the S&P 500
- This index remains near record highs, but bearish pressure continues to rise
- The Bull Bear Power Indicator of the S&P 500 shows a negative divergence
Market Sentiment Analysis
Equity markets closed marginally lower yesterday, with today’s CPI report for July in focus. Economists expect an increase in consumer inflation, and a higher-than-expected number could drive stocks lower. US President Trump agreed to delay the harshest Chinese tariffs for another 90 days to allow for negotiations to continue, keeping the TACO (Trump always chickens out) trade alive. Legal experts question the legality of the deal Trump struck with NVIDIA and AMD. Both companies agreed to pay 15% of their revenues from China chip sales to the government.
Equifax Fundamental Analysis
Equifax is a consumer credit reporting agency and belongs to the Big Three, alongside Experian and TransUnion. It collects data on over 800 million consumers and 88 million businesses globally.
So, why am I bearish on EFX despite its sell-off?
Current valuations remain high, and the EBITDA contraction despite higher revenues is a significant red flag. EFX admitted that litigation costs will continue to remain high, which could further decrease shareholder value. The high debt-to-equity ratio is another area of concern, and I cannot ignore the contraction in profit margins, while the average return on invested capital is below the industry average.
Equifax Fundamental Analysis Snapshot

The price-to-earnings (P/E) ratio of 46.80 makes EFX an expensive stock. By comparison, the P/E ratio for the S&P 500 is 29.49.
The average analyst price target for EFX is 280.65. It suggests healthy upside potential, but the current environment points to greater downside risks.
Equifax Technical Analysis
Today’s EFX Signal

- The EFX D1 chart shows price action inside a bearish price channel
- It also shows price action moving lower between its descending 0.0% and 38.2% Fibonacci Retracement Fan level
- The Bull Bear Power Indicator is bearish with a descending trendline
- Bearish trading volumes are notably higher than bullish trading volumes
- EFX corrected as the S&P 500 moved higher, a significant bearish trading signal
My Call
I am taking a short position in EFX between 233.24 and 241.46. EFX struggles with its balance sheet and high litigation costs. Higher revenues were unable to prevent a contraction in EBITDA, and profit margins are decreasing. I expect more downside ahead.
- EFX Entry Level: Between 233.24 and 241.46
- EFX Take Profit: Between 199.98 and 209.24
- EFX Stop Loss: Between 249.04 and 259.00
- Risk/Reward Ratio: 2.11
Ready to trade our free daily signals? Here is our list of the best brokers for trading worth checking out.
