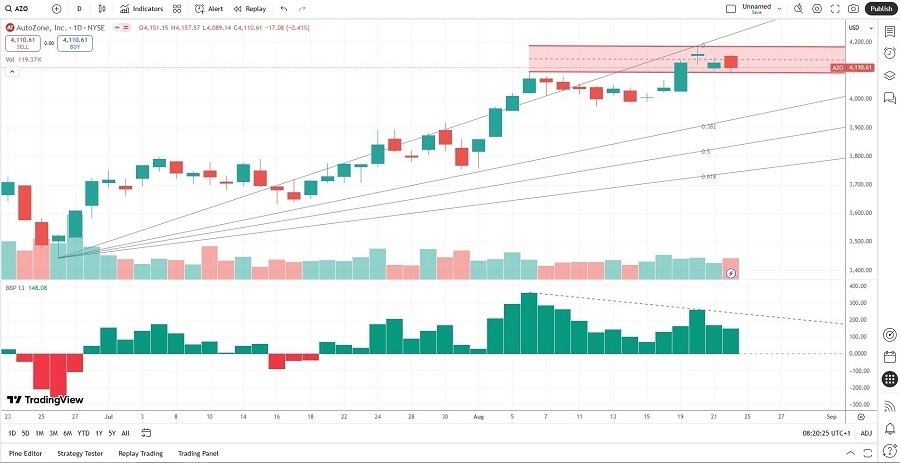
Short Trade Idea
Enter your short position between 4,094.69 (the lower band of its horizontal resistance zone) and 4,187.39 (the upper band of its horizontal resistance zone).
Market Index Analysis
- AutoZone (AZO) is a member of the S&P 500.
- This index trades near record highs, but bearish factors are dominant.
- The Bull Bear Power Indicator of the S&P 500 shows a negative divergence.
Market Sentiment Analysis
Following remarks by Fed Chief Powell at the Jackson Hole Economic Symposium last Friday, equity futures suggest a cautious start to the trading week. Market participants viewed the dovish speech as a sign of an interest rate cut, but the underlying factors that would cause looser monetary policy remain concerning. AI Bubble fears like the Dot-Com bubble continue to pose a threat. NVIDIA earnings on Wednesday and the July PCE report on Friday represent significant market movers this week.
AutoZone Fundamental Analysis
AutoZone is the largest US retailer of automotive parts. It thrives in the DIY sector and the automotive aftermarket. It operates over 7,100 locations across the US, Mexico, Brazil, Puerto Rico, and the US Virgin Islands.
So, why am I bearish on AZO despite its impressive market performance?
Tariffs, inflation, and weak consumer confidence pose significant risks in the near term. Valuations remain lofty, and the current ratio suggests that AutoZone may need to reconsider its massive share buybacks, which have artificially inflated earnings per share. AZO has ambitious expansion plans to open nearly 3,000 more stores, and the capital drain could further deflate its repurchase strategy.

AutoZone Fundamental Analysis Snapshot
The price-to-earning (P/E) ratio of 27.86 makes AZO an expensive stock. By comparison, the P/E ratio for the S&P 500 is 29.84.
The average analyst price target for AZO is 4,158.53. It shows no upside potential with excessive downside risk.
AutoZone Technical Analysis
Today’s AZO Signal

AZO Price Chart
- The AZO D1 chart shows price action inside its horizontal resistance zone.
- It also shows price action between its ascending 0.0% and 38.2% Fibonacci Retracement Fan levels.
- The Bull Bear Power Indicator is bullish but shows a negative divergence.
- The average bearish trading volumes are higher than the average bullish trading volumes.
- AZO failed to advance with the S&P 500 during the last trading session, a bearish warning signal.
My Call
I am taking a short position in AZO between 4,094.69 and 4,187.39. The current ratio and the share repurchase strategy raise red flags for me. Valuations are high, and the upside potential is limited, with rising downside risks for a short-term reversal.
Top Regulated Brokers
- AZO Entry Level: Between 4,094.69 and 4,187.39
- AZO Take Profit: Between 3,632.15 and 3,754.42
- AZO Stop Loss: Between 4,250.20 and 4,313.95
- Risk/Reward Ratio: 2.97
Ready to trade our daily Forex signals? Here’s a list of some of the best Forex trading platforms to check out.
