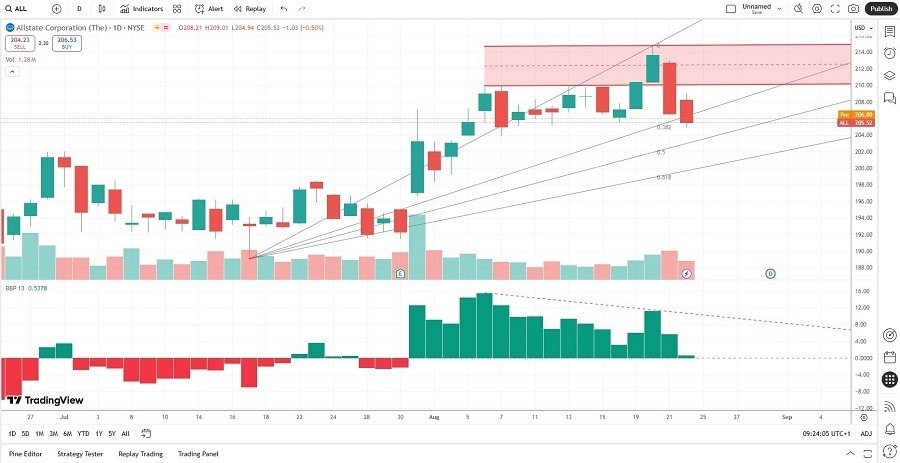
Short Trade Idea
Enter your short position between 204.94 (Friday’s intra-day low) and 209.86 (the lower band of its horizontal resistance zone).
Market Index Analysis
- Allstate (ALL) is a member of the S&P 500.
- This index trades near record highs, but bearish factors are dominant.
- The Bull Bear Power Indicator of the S&P 500 shows a negative divergence.
Market Sentiment Analysis
Following remarks by Fed Chief Powell at the Jackson Hole Economic Symposium last Friday, equity futures suggest a cautious start to the trading week. Market participants viewed the dovish speech as a sign of an interest rate cut, but the underlying factors that would cause looser monetary policy remains concerning. AI Bubble fears like the Dot-Com bubble continue to pose a threat. NVIDIA earnings on Wednesday and the July PCE report on Friday represent significant market movers this week.
Allstate Fundamental Analysis
Allstate is an insurance company and a Fortune 500 company. It has used the same advertising slogan since the 1950s and is one of the most recognized insurance companies.
So, why am I bearish on ALL after its breakdown?
Allstate faces declining profit margins, and the value destruction is notable. Insurers face an uncertain future with rising payouts tied to increased natural disasters resulting from global warming. The unsustainable dividend yields add to medium-term concerns, and ALL has no viable growth plans to maintain market share amid rising competition. I am also concerned about the current ratio. It makes ALL one natural disaster shy of serious financial troubles.

Allstate Fundamental Analysis Snapshot
The price-to-earnings (P/E) ratio of 9.67 makes ALL an inexpensive stock. By comparison, the P/E ratio for the S&P 500 is 29.84.
The average analyst price target for ALL is 229.68. It shows moderate upside potential, but the downside risks are notably higher.
Allstate Technical Analysis
Today’s ALL Signal

ALL Price Chart
- The ALL D1 chart shows price action completing a breakdown below its horizontal resistance zone.
- It also shows price action breaking down below its 38.2% Fibonacci Retracement Fan levels.
- The Bull Bear Power Indicator is bullish but has been contracting since the first week of August.
- The average bearish trading volumes are higher than the average bullish trading volumes.
- ALL failed to advance with the S&P 500, a significant bearish trading signal.
My Call
Top Regulated Brokers
I am taking a short position in ALL between 204.94 and 209.86. Shareholder value destruction, the absence of a growth strategy, and the current ratio suggest more downside risks ahead. I recommend selling the rallies in this insurance company.
- ALL Entry Level: Between 204.94 and 209.86
- ALL Take Profit: Between 187.39 and 196.67
- ALL Stop Loss: Between 212.99 and 214.76
- Risk/Reward Ratio: 2.18
Ready to trade our free daily Forex trading signals? We’ve shortlisted the best Forex trading brokers in the industry for you. t
