Long Trade Idea
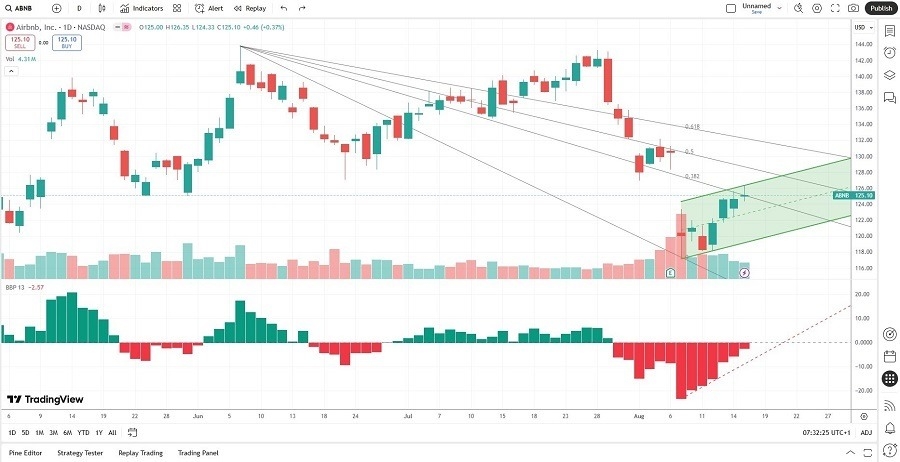
Enter your long position between 122.40 (the mid-point of its bullish price channel) and 126.35 (Friday’s intra-day high).
Market Index Analysis
- Airbnb (ABNB) is a member of the NASDAQ 100 and the S&P 500
- Both indices are near record highs, but average bearish trading volumes are higher than average bullish trading volumes since the first week of July
- The Bull Bear Power Indicator of the S&P 500 is bullish but shows a negative divergence
Market Sentiment Analysis
Equity markets will focus on this week’s Jackson Hole Economic Symposium and the speech by Federal Reserve Chair Jerome Powell. July’s PPI index has raised concerns among many economists, especially as markets price in an 85% chance of a 25-basis-point interest rate cut by the US central bank in September. The conditions for stagflation raise alarms, which could pressure equity markets into a much-anticipated correction. Consumer confidence and inflation expectations suggest more trouble ahead.
Airbnb Fundamental Analysis
Airbnb is the best-known online marketplace and broker for short-term rentals and long-term homestays. Despite its permanent ban on parties and events, the company continues to face stiff opposition to its properties in core markets.
So, why did I turn bullish on ABNB after its post-earnings plunge?
The sell-off drove price action into more reasonable valuations. I have turned bullish as business travel demand is accelerating, and the third quarter now represents peak travel demand. Companies are returning employees to the office, and a recent index tracking the sector reported a double-digit acceleration in business travel, and an over 50% surge in travel intensity.
Airbnb Fundamental Analysis Snapshot

The price-to-earnings (P/E) ratio of 30.36 makes ABNB an expensive stock. By comparison, the P/E ratio for the S&P 500 is 29.85.
The average analyst price target for ABNB is 140.40. It shows reasonable upside potential from current levels.
Airbnb Technical Analysis
Today’s ABNB Signal

- The ABNB D1 chart shows price action inside a bullish price channel
- It also shows a breakout above the descending 38.2% Fibonacci Retracement Fan level
- The Bull Bear Power Indicator is bearish but has improved over the past six sessions, with a potential bullish crossover pending
- The average trading volumes are higher now than during the previous advance
- ABNB corrected as the S&P 500 moved higher, a significant bearish trading signal, but bullish conditions have spiked
My Call
I am taking a long position in ABNB between 122.40 and 126.35. The expected surge in business travel during the third quarter could provide a boost to earnings and drive ABNB higher, driven by underlying fundamentals. I also like the current PEG ratio.
- ABNB Entry Level: Between 122.40 and 126.35
- ABNB Take Profit: Between 140.40 and 148.64
- ABNB Stop Loss: Between 115.68 and 117.28
- Risk/Reward Ratio: 2.68
Ready to trade our free daily signals? Here is our list of the best brokers for trading worth checking out.
