Short Trade Idea
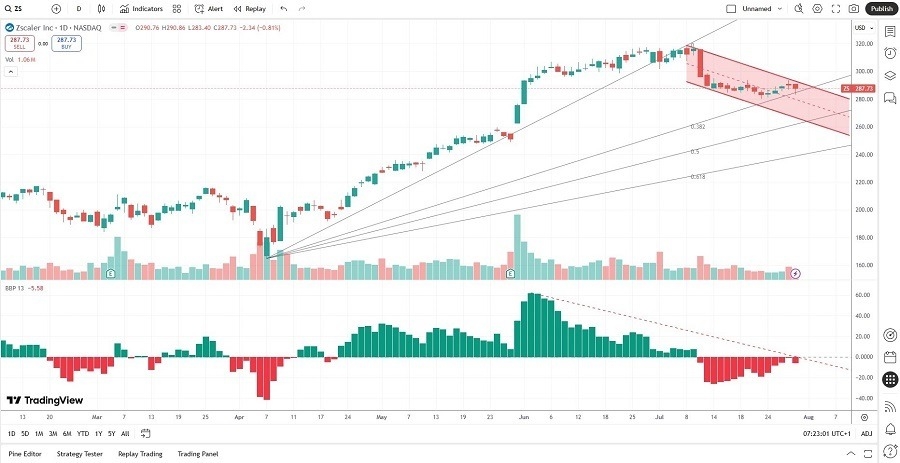
Enter your short position between 280.00 (the intra-day low before a minor drift higher) and 293.63 (the last intra-day high that touched the upper descending resistance level of its bearish price channel).
Market Index Analysis
- Zscaler (ZS) is a member of the NASDAQ 100.
- This index is at or near record highs, but without volume confirmation.
- The Bull Bear Power Indicator of the NASDAQ 100 shows a negative divergence.
Market Sentiment Analysis
Equity markets could open higher after Microsoft and Meta Platforms reported earnings, which confirms the AI trade continues to push equity markets higher. Ford warned of the tariff impact, adding to worries for the non-AI economy. A trade deal with South Korea, which includes 15% tariffs, added to bullish sentiment, but US Federal Reserve Chairman Powell noted that a September rate cut is not guaranteed. Investors should tread carefully, as equity markets rally on AI-related news, ignore tariff-related red flags, and hope for interest rate cuts.
Zscaler Fundamental Analysis
Zscaler is a cloud-based cybersecurity company. It continues to make small but strategic acquisitions to grow its product and services portfolio, including international ones.
So, why am I bearish on ZS following its sell-off?
ZS has reported negative earnings growth for five consecutive years, yet its share price has nearly doubled since the April lows. Its valuations neither justify the price nor its current business model. It has acquired an AI-based cloud cybersecurity, but it trails its competitors. I see more downside ahead for this company amid its sky-high valuations.
Zscaler Fundamental Analysis Snapshot

The forward price-to-earnings (P/E) ratio of 77.52 makes ZS an expensive stock. By comparison, the P/E ratio for the NASDAQ 100 is 41.55.
The average analyst price target for ZS is 315.61. While it suggests good upside potential, the downside risks dominate.
Zscaler Technical Analysis
Today’s ZS Signal

- The ZS D1 chart shows price action inside a bearish price channel.
- It also shows price action challenging its 38.2% Fibonacci Retracement Fan level.
- The Bull Bear Power Indicator is bearish with a descending trendline since June.
- The average trading volumes during selloffs are higher than during rallies.
- ZS corrected as the NASDAQ 100 rallied to fresh highs, a significant bearish development.
My Call
I am taking a short position in ZS between 280.00 and 293.63. With a forward price-to-earnings (P/E) ratio of 77.52, negative earnings over the past five years, and an underwhelming product portfolio, I believe the bearish price channel can guide price action lower, especially during a market correction.
- ZS Entry Level: Between 280.00 and 293.63
- ZS Take Profit: Between 217.10 and 227.69
- ZS Stop Loss: Between 301.85 and 318.46
- Risk/Reward Ratio: 2.88
Ready to trade our free signals? Here is our list of the best brokers for trading worth checking out.
