
Declining profit margins, fully valued shares based on average analyst estimates, and an excessive PE ratio receive assistance from a technical breakdown to create an appealing medium-term trading opportunity.
Short Trade Idea
Enter your short position between 111.33 (the lower band of its horizontal resistance zone) and 118.35 (the upper band of its horizontal resistance zone).
Market Index Analysis
- Shopify (SHOP) is a member of the NASDAQ 100.
- This index is near record highs, but technical cracks flash warning signals, especially for non-AI companies, including a head-and-shoulders pattern, a reversal chart pattern.
- The Bull Bear Power Indicator of the NASDAQ 100 shows a negative divergence.
Market Sentiment Analysis
Following yesterday’s AI-led rally, where NVIDIA became the first company to top a market capitalization of $4 trillion, futures indicate another sell-off. US President Trump took another swipe at BRICS, especially Brazil, which threatened to retaliate against the 50% tariff. It also complicates the trade relationship with India, another member of BRICS. While AI-related companies push higher, the rest of the market shows more signs of technical weakness ahead. Optimism about tariffs and inflation appears excessively bullish, creating a backdrop for sharp corrections.
Shopify Fundamental Analysis
Shopify is a leading e-commerce platform with nearly 60% of its business in the US. It is known as the go-to e-commerce platform for startups due to its fair fee structure and user-friendly platform.
So, why am I bearish on SHOP after its recent advance?
The valuations are excessive, and Shopify registered years of profit margin contractions. I think SHOP is ripe for a profit-taking sell-off with tariff uncertainty pressuring economic forecasts. While it remains a popular growth stock, it is more highly valued than some AI-related tech companies. I also see little growth outside of its core market, and its recent acquisitions suggest that SHOP is attempting to enter the gaming and technology sectors, which will require significant investments that may lead to short-term earnings disappointments.
Metric | Value | Verdict |
PE Ratio | 92.94 | Bearish |
PB Ratio | 13.42 | Bearish |
PEG Ratio | 1.12 | Bullish |
Current Ratio | 3.71 | Bullish |
ROIC-WACC Ratio | Positive | Bullish |
Shopify Fundamental Analysis Snapshot
The price-to-earning (PE) ratio of 92.94 makes SHOP an expensive stock. By comparison, the PE ratio for the NASDAQ 100 is 40.41.
The average analyst price target for SHOP is 115.18. It suggests fully valued shares with rising downside risks.
Shopify Technical Analysis
Today’s SHOP Signal
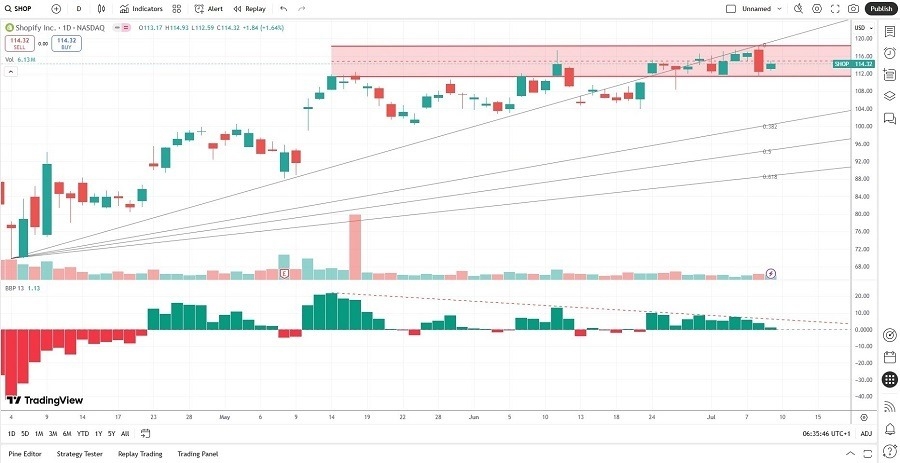
Shopify Price Chart
- The SHOP D1 chart shows price action inside a significant horizontal resistance zone.
- It also shows the Fibonacci Retracement Fan level acting as ascending resistance.
- The Bull Bear Power Indicator is bullish but shows a negative divergence with a pending bearish centerline breakdown.
- The average trading volumes during selloffs are higher than during advances.
- SHOP has traded in a tight range as the NASDAQ 100 rallied, a bearish sign.
My Call
I am taking a short position in SHOP between 111.33 and 118.35. I see limited upside potential amid unsustainable valuations, and I cannot ignore the multi-year contraction in profit margins. While I appreciate the attempts to enter the gaming and tech sector, SHOP will either fail or must invest heavily, which could further squeeze margins as the economic picture remains cloudy at best.
- SHOP Entry Level: Between 111.33 and 118.35
- SHOP Take Profit: Between 88.14 and 99.01
- SHOP Stop Loss: Between 119.85 and 122.00
- Risk/Reward Ratio: 2.72
Top Regulated Brokers
Ready to trade our free signals? Here is our list of the best stock trading platforms worth checking out.