
Excellent profit margins and returns on assets are facing a slowing appetite among fast food diners, while healthier competitors are taking market share. The recent rise in bullish sentiment has created an interesting trade, but how strong are the resistance levels?
Short Trade Idea
Enter your short position between 299.30 (the lower band of its horizontal resistance zone) and 305.69 (the upper band of its horizontal resistance zone).
Market Index Analysis
- McDonald’s (MCD) is a member of the Dow Jones Industrial Average, the S&P 100, and the S&P 500.
- All three indices remain near record highs with rising bearish momentum.
- The Bull Bear Power Indicator of the S&P 500 shows a negative divergence.
Market Sentiment Analysis
Except for AI-related stocks, equity markets sold off yesterday, as investors received their first inflation data showing the impact of US President Trump’s tariffs. Today’s PPI data could magnify concerns and provide a reality check. The second quarter earnings season is off to a rocky start after big banks failed to impress. Trump’s crypto bills hit a roadblock in Congress, adding to downbeat sentiment. Futures prices suggest a continuation of yesterday’s mild pullback, which could accelerate after today’s PPI report and earnings releases.
McDonald’s Fundamental Analysis
McDonald’s is a fast-food chain with the second-most locations globally. It is also a significant real estate owner and investor, and the second-largest private employer with over 1.7 million employees.
So, why am I bearish on MCD after its recent bounce higher?
I like the profit margins and the return on assets, but McDonald’s struggles with declining appetite from casual diners who prefer healthier options of its core competitors. With consumer wallets tight and the necessary promotions to attract in-store foot traffic, I expect issues on the horizon that could threaten its reasonable dividend. Revenues and earnings per share have also contracted, and its balance sheet health is not ideal.
Metric | Value | Verdict |
PE Ratio | 26.44 | Bearish |
PB Ratio | 8.33 | Bearish |
PEG Ratio | 2.67 | Bearish |
Current Ratio | 1.18 | Bearish |
ROIC-WACC Ratio | Positive | Bullish |
McDonald’s Fundamental Analysis Snapshot
The price-to-earning (PE) ratio of 26.44 makes MCD an expensive stock. By comparison, the PE ratio for the S&P 500 is 28.93.
The average analyst price target for MCD is 328.61. It points towards more upside potential, but its next earnings release could trigger downgrades.
McDonald’s Technical Analysis
Today’s MCD Signal
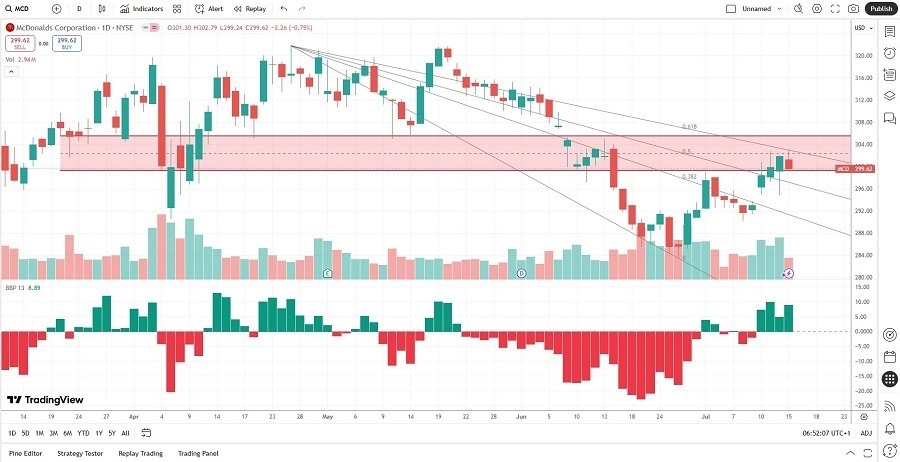
- The MCD D1 chart shows price action inside a horizontal resistance zone.
- It also shows the descending Fibonacci Retracement Fan adding downside pressure.
- The Bull Bear Power Indicator is bullish, but bearish pressures are rising.
- The average trading volumes during the correction were higher than during the rally.
- MCD struggled as the S&P 500 rallied to fresh highs.
My Call
I am taking a short position in MCD between 299.30 and 305.69. The pending breakdown below its horizontal resistance zone could trigger a double breakdown below its Fibonacci Retracement Fan and new 2025 lows in the third quarter.
- MCD Entry Level: Between 299.30 and 305.69
- MCD Take Profit: Between 243.53 and 250.23
- MCD Stop Loss: Between 315.62 and 321.72
- Risk/Reward Ratio: 3.42
Ready to trade our free signals? Here is our list of the best broker for trading worth checking out.
Top Regulated Brokers