
A conglomerate in the early stages of splitting into three publicly traded companies in an attempt to unlock shareholder value, while also selling non-core multi-billion dollar revenue companies to streamline operations, makes an appealing long-term case. Should you buy Honeywell at current levels?
Long Trade Idea
Enter your long position between 234.00 (the lower band of its horizontal support zone) and 241.72 (its most recent intra-day high).
Market Index Analysis
- Honeywell International (HON) is a member of the Dow Jones Industrial Average, NASDAQ 100, the S&P 100, and the S&P 500.
- All four indices are at or near record highs, driven by AI-related companies. At the same time, bearish warning signs continue to accumulate.
- The Bull Bear Power Indicator of the S&P 500 shows a negative divergence and does not confirm the second-quarter rally.
Market Sentiment Analysis
Equity markets brushed off Trump’s fresh tariff threat for the EU and Mexico, betting on the TACO (Trump Always Chickens Out) trade and a reduction in final tariffs by the August 1st deadline to reach a compromise. Today is the start of the second-quarter earnings season, with banks expected to deliver another stellar quarter. Traders will also get June inflation data that will show the impact of recent tariffs and provide much-needed guidance. While futures are down, the picture could change as bank earnings roll in this week, but traders should expect volatility ahead.
Honeywell International Fundamental Analysis
Honeywell International is a conglomerate with aerospace, building automation, industrial automation, and energy and sustainability solutions (ESS) as its core sectors. Additionally, it operates Sandia National Laboratories and has a global workforce of over 100,000 employees.
So, why am I bullish on HON near its 52-week high?
HON will benefit from an increase in defense spending by the US and its allies and from the domestic manufacturing uptick under the second Trump administration, especially in data centers. Hedge funds consider Honeywell International the best manufacturing stock, and I see more upside potential, but it could be a bumpy ride higher. Still, I will buy the dip on this undervalued company.
Metric | Value | Verdict |
PE Ratio | 27.36 | Bearish |
PB Ratio | 8.77 | Bearish |
PEG Ratio | 2.36 | Bearish |
Current Ratio | 1.25 | Bearish |
ROIC-WACC Ratio | Positive | Bullish |
Honeywell International Fundamental Analysis Snapshot
The price-to-earning (PE) ratio of 27.36 makes HON a somewhat expensive stock. By comparison, the PE ratio for the S&P 500 is 28.75.
The average analyst price target for HON is 241.23. However, I expect upside revisions ahead after its earnings outlook.
Honeywell International Technical Analysis
Today’s HON Signal
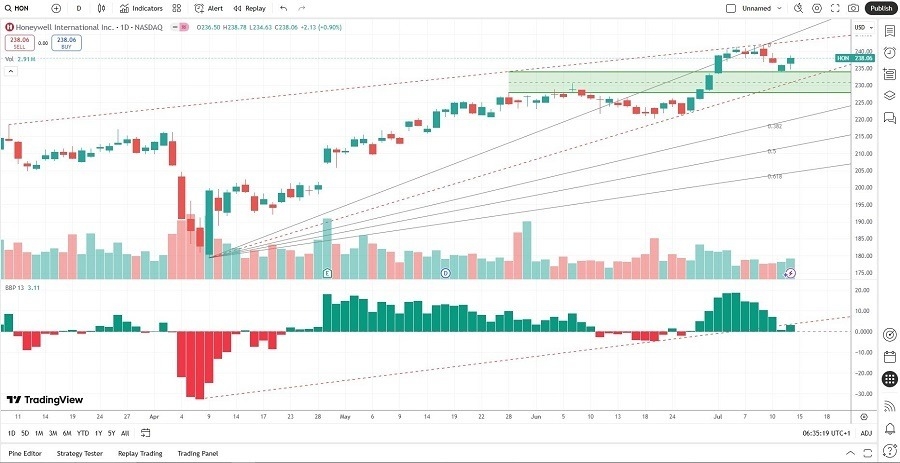
Honeywell Price Chart
- The HON D1 chart shows price action converting a horizontal resistance zone into support.
- It also shows a rising wedge, a bearish chart pattern, confirming conflicting signals and the likelihood of volatility ahead.
- The Bull Bear Power Indicator is bullish.
- The average trading volumes during rallies are higher than during selloffs.
- HON advanced with the S&P 500 corrected.
My Call
I am taking a long position in HON between 234.00 and 241.72. Honeywell International is likely to face a bumpy ride ahead, but it will perform well as markets climb a wall of worry higher. It should also outperform during selloffs due to its defensive capabilities. I expect the Fibonacci Retracement Fan to support higher prices in the second half of 2025.
- HON Entry Level: Between 234.00 and 241.72
- HON Take Profit: Between 263.24 and 274.00
- HON Stop Loss: Between 220.20 and 226.11
- Risk/Reward Ratio: 2.12
Ready to trade our daily signals? Here is our list of the best broker for trading worth checking out.
Top Regulated Brokers