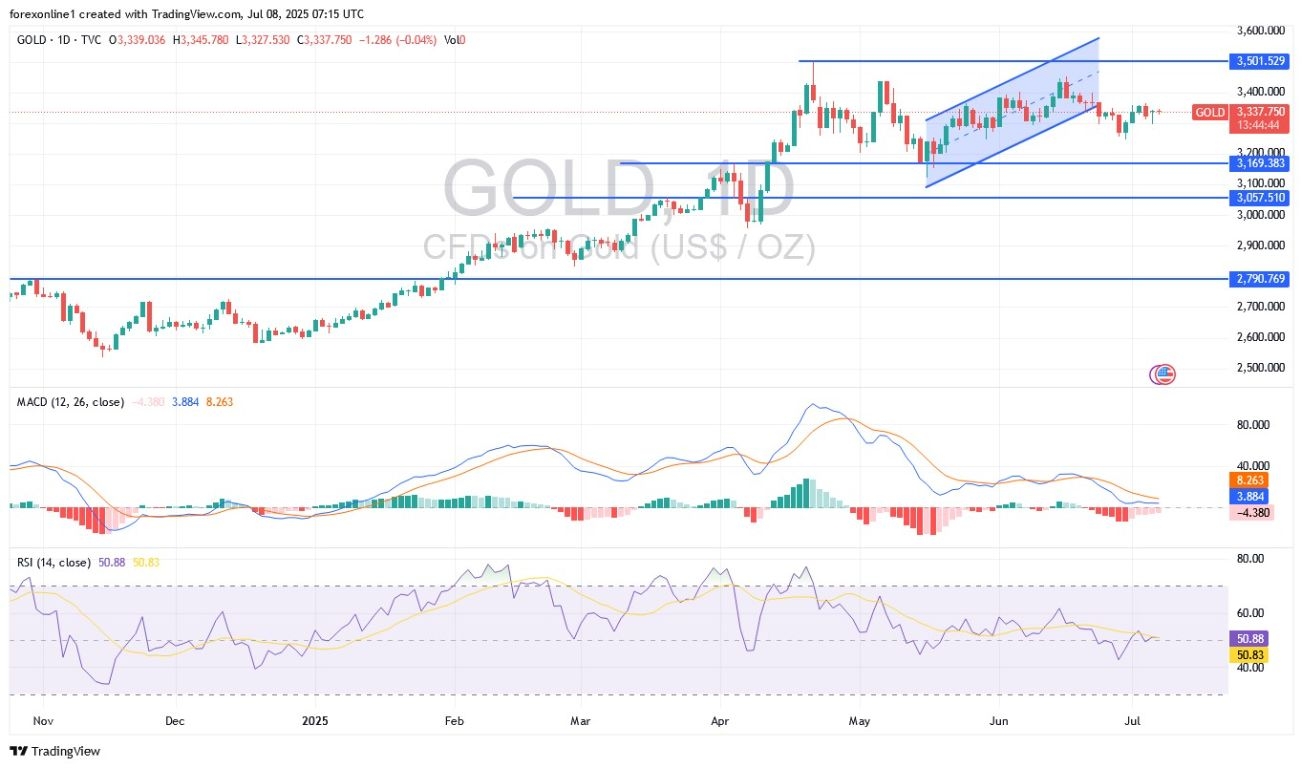
Today’s Gold Analysis Overview:
- The overall Gold Trend: Undergoing a relative bearish correction.
- Today's Gold Support Levels: $3272 – $3240 – $3200 per ounce.
- Today's Gold Resistance Levels: $3325 – $3360 – $3400 per ounce.

Today's gold trading signals update:
- Sell gold from the resistance level of $3360, with a target of $3280 and a stop loss of $3380.
- Buy gold from the support level of $3265, with a target of $3350 and a stop loss of $3250.
Technical Analysis of Gold Price (XAU/USD) Today:
For the second consecutive day, the gold price indicator is facing selling pressure amidst improving sentiment and investors abandoning gold as a safe haven. This shift comes amid a recent breakthrough in resolving trade disputes between the United States and some other global economies. Consequently, instantaneous gold prices have fallen to the $3285 per ounce support level, around which they are stable at the time of writing this analysis. This week's high for gold prices was the $3345 per ounce resistance level.
Technically, a decline in gold prices below $3,300 per ounce could give bears the opportunity to move prices to lower levels, especially if the US dollar recovers and the US trade dispute with other global economies is resolved. Meanwhile, the only remaining strength for gold is global geopolitical tensions. Based on performance across gold trading platforms, gold is currently experiencing its third consecutive daily loss. The price of the yellow metal is hovering at its lowest level in more than a week, as traders abandon their bullish bets and move towards the US dollar and other yield-generating currencies.
Top Regulated Brokers
Trading Tips:
Monitor the decline in gold prices to seize new buying opportunities, but without taking excessive risks. Also, closely observe the influencing factors in the gold market to capitalize on the best trading opportunities.
On the other hand, gold generates no yield, so it is not particularly attractive when yields are rising. With the US Dollar Index (DXY) approaching its two-week high and the 10-year US Treasury yield nearing its three-week high, demand for gold as a safe haven is currently weak.
It's unusual in recent trading that gold, even with a free and exclusive no-deposit trading bonus, is not capitalizing on the wave of trade war fears this time. Instead, the US dollar is absorbing safe-haven flows, as traders prefer liquidity and yields. Gold's sluggish performance has left some optimists awaiting key upcoming catalysts: any signs of easing trade tensions, cautious hints from the US Federal Reserve, or erroneous data that might shake confidence in the strength of the US dollar.
Technical Indicators Are Trending Downward:
According to recent trading across trusted trading platforms, the downward movement in gold prices has caused technical indicators to break through levels that support the beginning of bear control of the trend. Technically, the 14-day Relative Strength Index (RSI) is now around a reading of 45 after breaking the midline. Also, the MACD (Moving Average Convergence Divergence) indicator lines are at a 12.26 close, close to breaking the midline. Bearish control over gold's direction will increase if prices move towards the $3260 and $3220 per ounce support levels, respectively. On the upside, as previously mentioned, stability around and above the $3300 per ounce resistance will continue to incentivize bullish control over gold's direction.
Ready to trade today’s Gold prediction? Here’s a list of some of the best XAU/USD brokers to check out.
