
Bullish view
- Buy the GBP/USD pair and set a take-profit at 1.3600.
- Add a stop-loss at 1.3300.
- Timeline: 1-2 days.
Bearish view
- Sell the GBP/USD pair and set a take-profit at 1.3300.
- Add a stop-loss at 1.3600.
The GBP/USD exchange rate has crashed in the past few days, moving from the year-to-date high of 1.3790 on July 1 to the current 1.3430, its lowest point since June 23rd.
Top Regulated Brokers
US and UK Inflation Data Ahead
The GBP/USD pair continued its strong downward trend in the past few days as the US dollar index (DXY) bounced back. The DXY Index jumped to a high of $98.11, its highest point since June 23rd.
It will next react to the upcoming US inflation data on Tuesday. Economists expect the data to show that the headline Consumer Price Index (CPI) rose from 0.1% in May to 0.3% MoM, while the core CPI moved from 0.1% to 0.4%.
The headline CPI is expected to come in at 2.7%, higher than the previous month’s 2.4%. Core inflation, which excludes the volatile food and energy prices, is expected to come in at 3%, up from the previous 2.8%.
If these numbers are accurate, it will mean that the headline CPI was moving in the opposite direction from the Fed’s target of 2.0%. Such a move will reduce the odds of the Federal Reserve cutting interest rates.
The GBP/USD exchange rate will next react to the upcoming UK inflation data. Economists expect the data to show that the headline and core CPI remained at 3.4% and 3.5%.
More data is expected to show that the headline retail sales remained unchanged at 0.2% and 4.3% on a MoM and YoY, respectively.
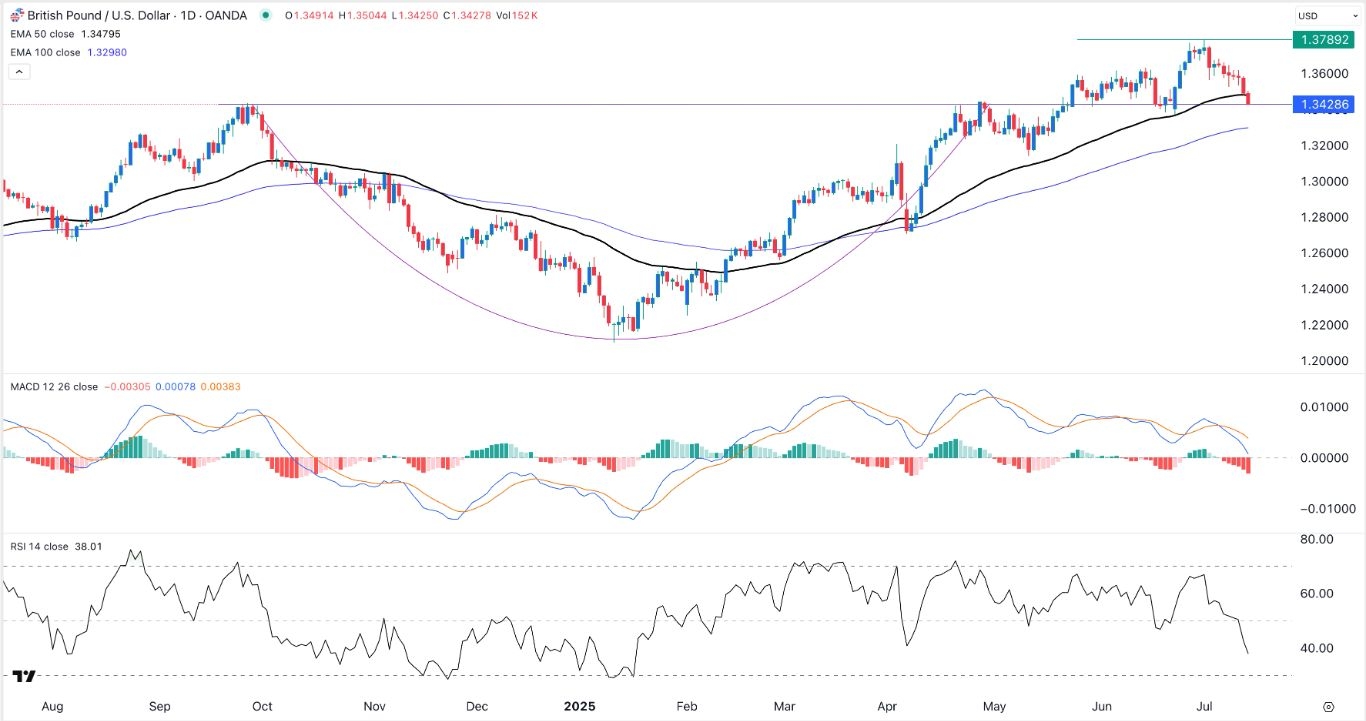
GBP/USD Technical Analysis
The daily chart shows that the GBP/USD exchange rate has pulled back in the past few days, moving from the year-to-date high of 1.3790 to the current 1.3425. It has moved slightly below the 50-day Exponential Moving Average (EMA).
The pair has retested the support at 1.3428, the highest point in September last year. It has formed a cup-and-handle pattern, one of the most bullish continuation sign.
Also, the Relative Strength Index (RSI) has moved below the neutral point at 50, while the MACD has moved below the neutral point. Therefore, the pair will likely bounce back and possibly retest the resistance level at 1.3525. A move below the 100-day moving average at 1.3300 will invalidate the bullish view.
Ready to trade our daily Forex forecast? Here’s some of the best forex broker UK reviews to check out.