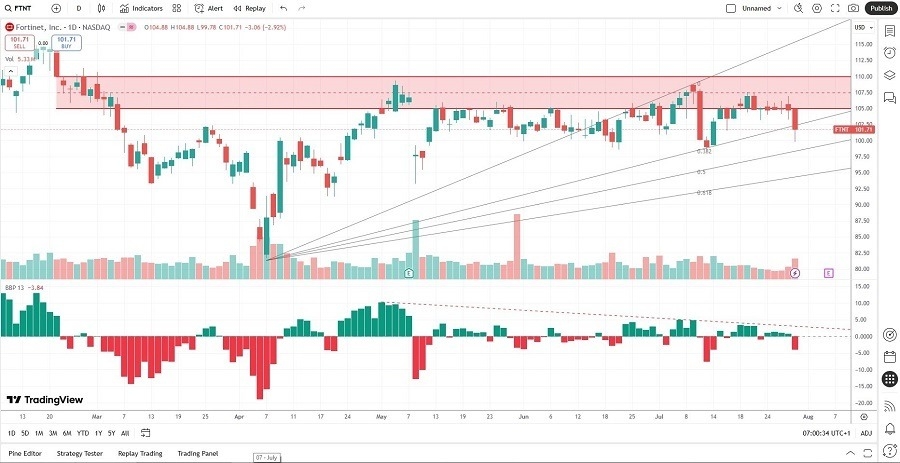
Short Trade Idea
Enter your short position between 99.78 (yesterday’s intra-day low) and 104.88 (yesterday’s intra-day high).
Market Index Analysis
- Fortinet (FTNT) is a member of the NASDAQ 100 and the S&P 500.
- Both indices are at or near record highs, but without volume confirmation.
- The Bull Bear Power Indicator of the NASDAQ 100 shows a negative divergence.
Market Sentiment Analysis
Equity markets could open higher after Microsoft and Meta Platforms reported earnings, which confirms the AI trade continues to push equity markets higher. Ford warned of the tariff impact, adding to worries for the non-AI economy. A trade deal with South Korea, which includes 15% tariffs, added to bullish sentiment, but US Federal Reserve Chairman Powell noted that a September rate cut is not guaranteed. Investors should tread carefully, as equity markets rally on AI-related news, ignore tariff-related red flags, and hope for interest rate cuts.
Fortinet Fundamental Analysis
Fortinet is a cybersecurity company with offices in dozens of countries. It ranks among the top-rated large-cap growth stocks and expands its market share via acquisitions.
So, why am I bearish on FTNT after its breakdown?
Valuations are my primary concern. It also appears that Fortinet falls behind competitors in the AI sector, but the next earnings call may provide more details. The balance sheet is decent, but it does not support future acquisitions. While FTNT has assembled the right tools and services, I believe the positive news is already in the current share price, and that this company will face a correction to adjust current valuations.

The price-to-earnings (P/E) ratio of 41.86 makes FTNT an expensive stock. By comparison, the P/E ratio for the NASDAQ 100 is 41.55.
The average analyst price target for FTNT is 109.88. It exhibits moderate upside potential but also carries growing downside risks.
Fortinet Technical Analysis
Today’s FTNT Signal

- The FTNT D1 chart shows a breakdown below its horizontal resistance zone.
- It also shows price action challenging its 38.2% Fibonacci Retracement Fan level.
- The Bull Bear Power Indicator has turned bearish with a descending trendline since May.
- The average trading volumes during selloffs are higher than during rallies.
- FTNT corrected as the NASDAQ 100 rallied to fresh highs, a significant bearish development.
My Call
I am taking a short position in FTNT between 99.78 and 104.88. FTNT failed to push to fresh highs as the NASDAQ 100 Index advanced. Its valuation is high and does not justify the current price. FTNT is also falling behind in the AI race. Therefore, I am selling the breakdown.
- FTNT Entry Level: Between 99.78 and 104.88
- FTNT Take Profit: Between 81.70 and 89.33
- FTNT Stop Loss: Between 108.77 and 114.63
- Risk/Reward Ratio: 2.01
Ready to trade our free signals? Here is our list of the best brokers for trading worth checking out.
