
Expensive valuations, slowing revenues, and economic weakness widen fundamental issues for high-flying Fastenal. The addition of an interesting technical picture creates an appealing medium-term trading opportunity.
Short Trade Idea
Enter your short position between 42.24 (the low of a hammer candlestick) and 43.21 (the 52-week high).
Market Index Analysis
- Fastenal (FAST) is a member of the NASDAQ 100 and the S&P 500.
- Both indices are near record highs, but the technical rally shows signs of a potential reversal
- The Bull Bear Power Indicator of the NASDAQ 100 shows a negative divergence, and half of a reversal chart pattern has formed.
Market Sentiment Analysis
Equity markets digest US President Trump’s higher-than-expected tariff announcements on several key trading partners. Yesterday’s sell-off showed a mix of disappointment and optimism that President Trump uses threats to apply pressure to reach short-term concessions before backing down towards deadlines. Traders refer to it as the TACO (Trump Always Chickens Out) trade. Central bank actions will also attract more attention after the Reserve Bank of Australia surprised markets by holding rates steady rather than cutting interest rates.
Fastenal Fundamental Analysis
Fastenal is an industrial supply and stock-keeping unit with over 690,000 items. It refers to itself as a supply chain solutions company. It primarily caters to the construction and manufacturing sector.
So, why am I bearish on FAST after it recorded a fresh 52-week high?
Fastenal has experienced a slowdown in revenues at a time when the company is burning cash to defend its market position. FAST has also increased its overall share count over the past year and could issue more shares to finance its business plan. The economic outlook for the second half of 2025 remains cloudy, magnified by elevated inflation and tariff uncertainty. The second-quarter earnings report scheduled for release next Monday could provide another fundamental trigger for a downward adjustment in the share price of FAST.
Metric | Value | Verdict |
PE Ratio | 42.47 | Bearish |
PB Ratio | 13.20 | Bearish |
PEG Ratio | 3.84 | Bearish |
Current Ratio | 4.28 | Bullish |
ROIC-WACC Ratio | Positive | Bullish |
Fastenal Fundamental Analysis Snapshot
The price-to-earning (PE) ratio of 42.47 makes FAST an expensive stock. By comparison, the PE ratio for the NASDAQ 100 overall is 40.70.
The average analyst price target for FAST is 38.10. It confirms that price action overshot its target with medium-term downside potential ahead.
Fastenal Technical Analysis
Today’s FAST Signal
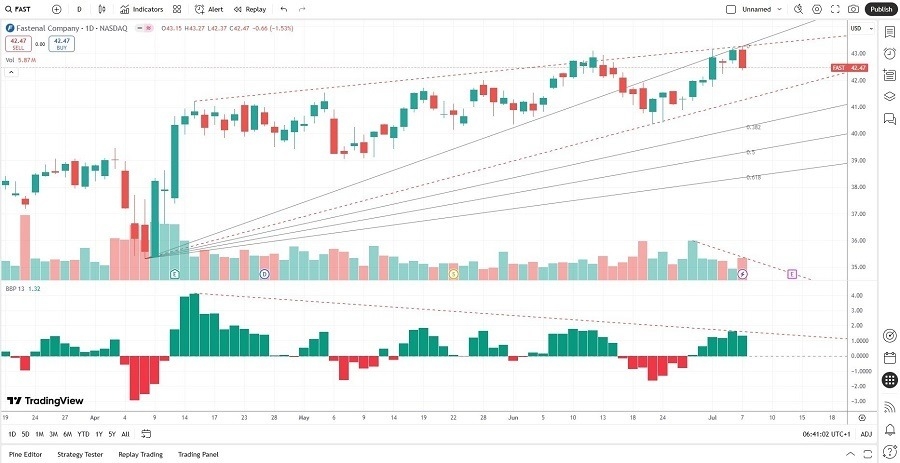
Fastenal Price Chart
- The FAST D1 chart shows a rising wedge formation, a bearish chart pattern.
- It also shows the Fibonacci Retracement Fan level acting as ascending resistance.
- Trading volumes decreased as price action increased, suggesting a weak uptrend without conviction.
- The Bull Bear Power Indicator is bullish, but a negative divergence has formed, adding to bearish triggers.
- Short interest by institutional investors rose to extreme bearish levels.
Top Regulated Brokers
My Call
I am taking a short position in FAST between 42.24 and 43.21. The bearish factors outweigh its industry-leading return on assets. Over the past two years, revenue growth slowed, and Fastening faces stiff competition in its sector. Combined with the technical cracks, I think the share price is due for a correction to challenge its April low.
- FAST Entry Level: Between 42.24 and 43.21
- FAST Take Profit: Between 35.31 and 37.38
- FAST Stop Loss: Between 44.64 and 46.06
- Risk/Reward Ratio: 2.89
Ready to trade our free signals? Here is our list of the best stock trading platforms worth checking out.