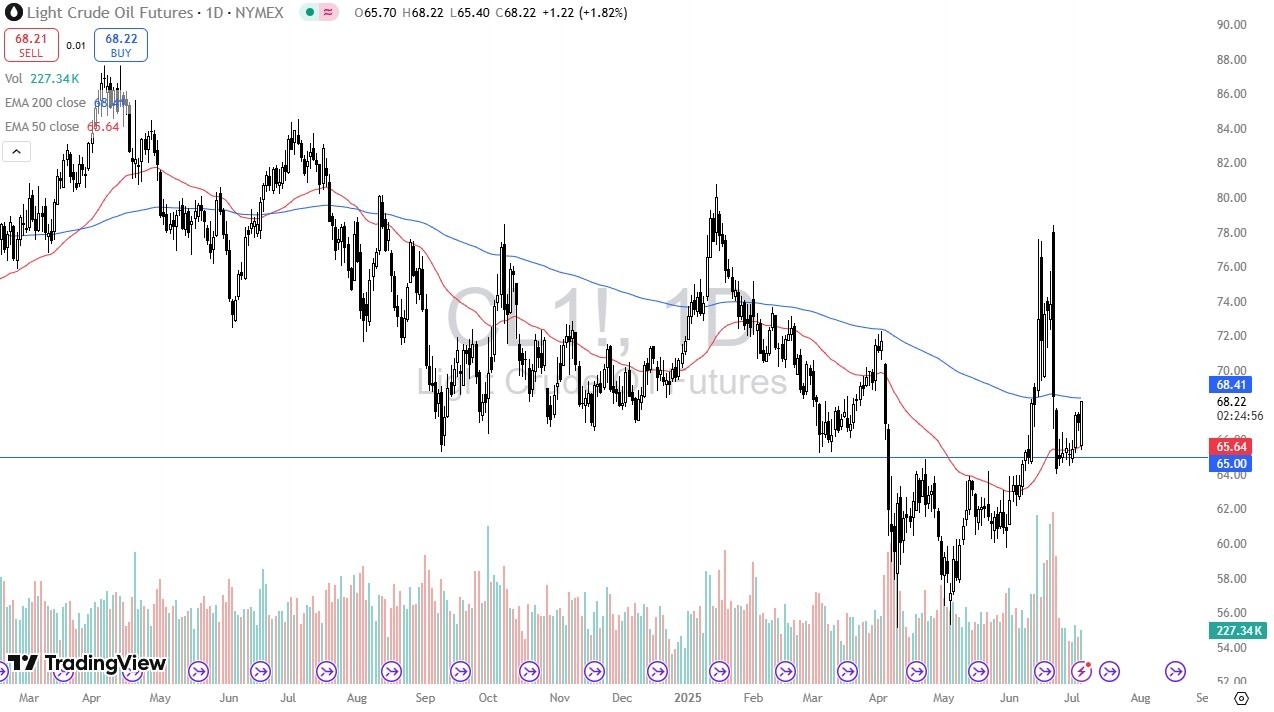
- The Light Sweet Crude oil market has initially gapped lower to kick off the trading session on Monday, only to bounce from the 50 Day EMA, and show signs of life again.
- In fact, the market turned around quite drastically, forming what you would look at through the prism of a massive “bullish engulfing candlestick.”
- With that being the case, we are now sitting just below the 200 Day EMA, which of course is an indicator that people have been paying attention to for some time, and I think that will remain an area that you need to pay close attention to.

If we can break above the 200 Day EMA, then it’s likely that traders will continue to pile into this market, which is what I fully anticipate due to the fact that this is a time of year where crude oil typically does fairly well, and of course we had been rallying even before the conflict between Iran and Israel. That only put things into higher gear, but as we pull back, we tested a very important level.
Top Regulated Brokers
Important Level
The most important level in this chart from what I can see is the $65 level, which previously had been a significant amount of resistance, but now has offered significant support. Furthermore, the 50 Day EMA sits just above there, so I do think you have a situation where you could see plenty of technical traders willing to get involved, and so far, that is exactly what has occurred. All things being equal, as long as we can say above the $65 level, I think this is a market that continues to look bullish overall, and I have no interest in trying to get too cute here and shorting the market. Because of this, traders will continue to look at this as a “buy on the dips” scenario, but I also expected to be very volatile. I expect more of a grind higher than anything else, perhaps getting all the way to the $75 level over the next couple of months.
Ready to trade the daily crude oil Forex forecast? Here’s a list of some of the best Oil trading platforms to check out.
